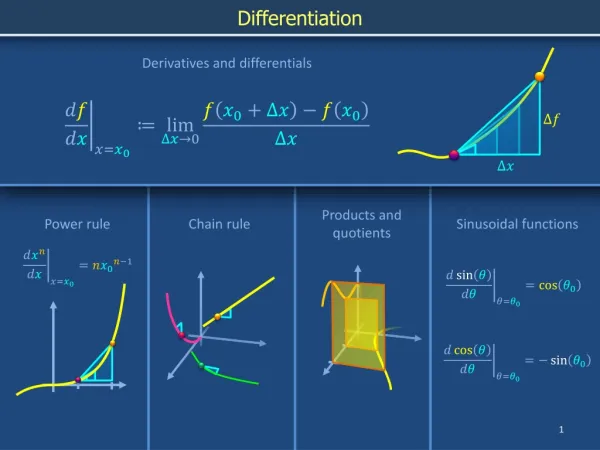
Sinusoidal Modeling I: Trig Equation from Data Points
Learn how to derive a trigonometric equation from data points, including finding amplitude, period, translation terms, and applying standard formulas.

Sinusoidal Modeling I: Trig Equation from Data Points
E N D
Presentation Transcript
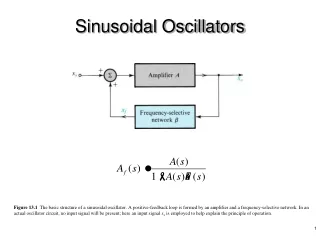
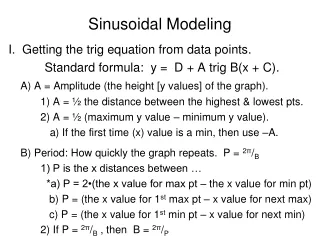
Sinusoidal Modeling I. Getting the trig equation from data points. Standard formula: y = D + A trig B(x + C). A) A = Amplitude (the height [y values] of the graph). 1) A = ½ the distance between the highest & lowest pts. 2) A = ½ (maximum y value – minimum y value). a) If the first time (x) value is a min, then use –A. B) Period: How quickly the graph repeats. P = 2π/B 1) P is the x distances between … *a) P = 2•(the x value for max pt – the x value for min pt) b) P = (the x value for 1st max pt – x value for next max) c) P = (the x value for 1st min pt – x value for next min) 2) If P = 2π/B , then B = 2π/P
Sinusoidal Modeling I. Getting the trig equation from data points. Standard formula: y = D + A trig B(x + C). C) Horizontal translation (the C term). A shift along the x-axis. (It’s best to use the cosine function as your trig function.) 1) Find the 1st time value (is it a max or min?). Influences A. a) That x value is the C term (change the sign). b) If (x , y) is the max point, then (C , max y value). becomes f(x) = cos (x – C) [we change the sign]. D) Vertical translation (the D term). A shift along the y-axis 1) Find the average of the max & min heights. a) D = ½ (max height + min height) [height is y values]
Sinusoidal Modeling Standard formula: y = D + A trig B(x + C). Example: The table below shows the high temperatures for each month for Tallahassee. Write a trig model for the data. A = ½ (maximum y value – minimum y value) A = ½ (92.0 – 63.8) A = ½ (28.2) A = 14.1 P = 2 • (the x value for max pt – the x value for min pt) P = 2 • (7 – 1) P = 2 • (6) B = 2π/P = 2π/12 = π/6 P = 12
Sinusoidal Modeling Standard formula: y = D + A trig B(x + C). Horizontal translation (the C term). A shift along the x-axis. Find the x value when its at its maximum height (y). (7, 92.0) That x value is the C term (change the sign). So C = –7 Vertical translation (the D term). A shift along the y-axis D = ½ (max height + min height) [height is y values] D = ½ (92.0 + 63.8) = ½ (155.8) = 77.9 A = 14.1 B = π/6 C = –7 D = 77.9 Use cosine: y = 77.9 + 14.1 cos π/6(x – 7)