Phys 1830: Lecture 28
300 likes | 334 Views
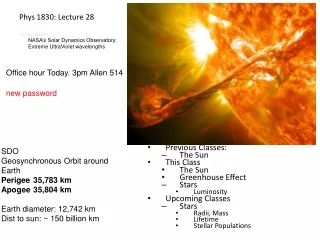
Phys 1830: Lecture 28. NASA’s Solar Dynamics Observatory: Extreme UltraViolet wavelengths. Office hour Today. 3pm Allen 514. new password. SDO Geosynchronous Orbit around Earth Perigee 35,783 km Apogee 35,804 km Earth diameter: 12,742 km Dist to sun: ~ 150 billion km.

Phys 1830: Lecture 28
E N D
Presentation Transcript
Phys 1830: Lecture 28 NASA’s Solar Dynamics Observatory: Extreme UltraViolet wavelengths Office hour Today. 3pm Allen 514 new password SDO Geosynchronous Orbit around Earth Perigee 35,783 km Apogee 35,804 km Earth diameter: 12,742 km Dist to sun: ~ 150 billion km • Previous Classes: • The Sun • This Class • The Sun • Greenhouse Effect • Stars • Luminosity • Upcoming Classes • Stars • Radii, Mass • Lifetime • Stellar Populations
The Sun Unexpectedly the atmospheric temperature increases with distance from the core! Probably caused by disturbances in the Sun’s magnetic field. • The photosphere is the visible "surface" of the Sun. • Below it lie the convection zone, the radiation zone, and the core. • Above the photosphere, the solar atmosphere consists of the chromosphere, the transition zone, and the corona
Prominences • Loops or sheets of plasma trace the magnetic field lines in or near sunspots. • Extensions up to 10 times the diameter of Earth. • Last for days or weeks.
Solar Flares and Coronal Mass Ejections • Green: solar flare -- can also be seen in X-ray (100 million K) • Flash across region in minutes and blast into space. • Red: coronal mass ejection • Giant magnetic bubbles of ionized gas separating from the solar atmosphere. • Occur weekly at sunspot mininum and a few times a day at maximum. • Blue: proton shower – recall fast moving particles are called cosmic rays.
Solar Wind • Continous stream of electromagnetic radiation and cosmic rays. • from high in corona where gas is hot enough to escape. • From coronal holes – regions where magnetic field loops snap and extend into space.
High Resolution Coronal Imager (Hi-C telescope) energy pumped into corona when: • braids release • B fld lines cross
Earth’s Magnetosphere: Illustration • The Earth's magnetic field is complicated and will protect life even if a polarity shift was occurring. • However solar activity does disrupt satellite communications and power networks.
Influence of the Sun: The edge of the Solar System? (No) Solar Wind: The sun exhales a thin, hot wind of electrically conducting gas, called plasma, into space at about 1.5 million km per hr. • Heliosphere: The solar wind forms a large plasma bubble as the sun orbits in our Galaxy. The heliosphere has an inner and outer region. • Termination Shock: The thin, invisible boundary of the inner, solar wind region. • The solar wind abruptly drops in speed at the termination shock estimated between 80 – 100 AU (i.e. within the Kuiper Belt). • Voyagers 1 & 2 have crossed the termination shock. • Heliopause: Termination of the heliosphere. • Separates the solar material from the interstellar medium. • Estimated between 120 to 150 AU • IBEX is studying the heliosphere boundaries. • Voyager 1 crossed boundary at 125 AU • Bow Shock
Sun’s Influence: On Earth Recall Inverse Square Brightness Law
Sun’s Influence: On Earth • The sun’s luminosity is equivalent to the detonation of 10 billion 1-megaton nuclear bombs per second. • When this energy reaches the earth 30% is intercepted by the atmosphere. • 0-20% reflected by the clouds. • A sunbather receives the equivalent of 5 100-Watt light bulbs.
Sun’s Influence: On Earth • The relationship between earth and the sun is complex and is a frontier of research. • Can this lead to climate change? • The solar cycle leads to an increase in solar luminosity of 0.2-0.3 % during the peak. • This cycle could lead to weather patterns, but they are weaker than those caused by El Nino or volcanic dust.
Sun’s Influence: On Earth • Intergovernmental Panel on Climate Change. IPCC won Nobel Prize. • Thousands of scientists from all over the world contribute to the work of the IPCC on a voluntary basis. • See the IPCC summary and FAQ. • http://www.ipcc.ch/report/ar5/wg1/#.UoZuz6WLljE • http://www.climatechange2013.org/images/uploads/WGI_AR5_SPM_brochure.pdf • Climate Skeptic now says there is global warming: http://online.wsj.com/article/SB10001424052970204422404576594872796327348.html
New IPCC report – trends continue • Check the King’s Centre for Visualization in Science for interactives on climate change: http://www.kcvs.ca/site/projects/climate.html • Melting ice caps could disrupt ocean currents. If the Gulf Stream is responsible for heating Europe and it is disrupted, then Europe could experience an “ice age”. • Currently needs more research and monitoring of ocean currents.
Stars: Their Characteristics • Luminosity: energy output • Temperature • Size
Stars: Their Characteristics Recall Inverse Square Brightness Law Luminosity, or absolute brightness, is a measure of the total power radiated by a star. Apparent brightnessis how bright a star appears when viewed from Earth; it depends on theabsolute brightnessbut also on the distanceof the star.
Luminosity and Apparent Brightness Therefore, two stars that appear equally bright might be a closer, dimmer star and a farther, brighter one:
More Precisely 17-1: More on the Magnitude Scale Apparent brightness when measured using a logarithmic, magnitude scale, which is related to our perception is called apparent magnitude. Absolute magnitude is the apparent magnitude that a star would have if it were placed 10 parsecs from Earth. A reduction of 5 in magnitude corresponds to an increase in a factor of 100 in luminosity. Magnitudes are inverted in scale, such that bright stars have low magnitudes. Converting from magnitude to luminosity in solar units: This graph allows us to perform this conversion simply by reading horizontally.
Question 5 In the stellar magnitude system, a smaller magnitude indicates a _____ star. 1) brighter 2) hotter 3) cooler 4) fainter 5) more distant
Question 7 1) one million km. 2) one astronomical unit. 3) one light year. 4) ten parsecs. 5) ten light years. The absolute magnitude of a star is its brightness as seen from a distance of
Stars: Their Characteristics • Let’s now look at the properties of a star if you were at its surface. • Then “distance” is the radius of the star.
Stars: Their Characteristics • The flux (F) of energy radiated through a centimetre square patch on the surface per second.
20,000° K 10,000° K 5000° K Intensity 2000° K 1000° K 500° K Wavelength (nm) X-Ray Ultraviolet Visible Infrared Microwave Radio Star: Their characteristics Blackbody curves • Recall that stars radiate very similarly to ideal blackbodies. • Their flux (F) is related to their temperature (T). ( is a constant.)
Stars: Their Characteristics • Luminosity (L): The total energy radiated per second, at all wavelengths. • L = surface area * flux • Surface area of a sphere is Luminosity is proportional to the radius squared times surface temperature to the 4th power.
Stars: Why Temperature is useful. • Notice that if we know the temperature of a star, then if we know the radius, we can calculate the luminosity. • Alternatively, if we know the temperature and the luminosity we can determine the radius.
20,000° K 10,000° K 5000° K Intensity 2000° K 1000° K 500° K Wavelength (nm) X-Ray Ultraviolet Visible Infrared Microwave Radio Stars: Surface Temperatures Black body curves • Judiciously select filters and image the star in each of the filters using a CCD. • Measuring the magnitude of the star is called photometry. • Example of stars in HST data in .xcf file.
10,000° K 5000° K Intensity Wavelength (nm) Stars: Surface Temperatures Black body curves “Colour” is a proxy for temperature • The cool, red star will have a higher intensity (lower magnitude) in the red filter compared to its blue filter. • The hotter, blue star will have a higher intensity (lower magnitude) in its blue filter compared to its red filter. • We can then reconstruct the black body curve. • The black body curve temperature.
How do we determine the temperature? • One way is to do photometry on images of stars in different filters. • This gives points on the black body curve. • “Connecting the dots” of intensity can trace the black body curve. • the peak of the black body curve tells us the temperature of the star. • this procedure does not take much observing time.
hotter star cooler star
Review: • You are measuring the apparent magnitude of a star by doing photometry. You find that more light comes through the red filter than through the visual filter. Also more light comes through the visual filter than through the blue filter. (Hint draw the black body curve.) This means that the star • has a reddish colour and is cool. • has a greenish colour and is about the same temperature as our sun. • has a bluish colour and is very hot.