Download

1 / 34
340 likes | 375 Views
Explore the concept of Pareto efficiency in an exchange economy, analyzing the distribution of goods between individuals like Adam and Eve. Learn how Pareto efficiency ensures optimal resource allocation, where no one can benefit without others losing. Figures and examples illustrate efficient allocations and the contract curve in an Edgeworth Box model. Discover how marginal rates of substitution and indifference curves play a crucial role in determining Pareto efficiency. This analysis provides insights into economic efficiency and resource allocation in exchange economies.

E N D
Unit 16 – General equilibrium analysis and Economic efficiency
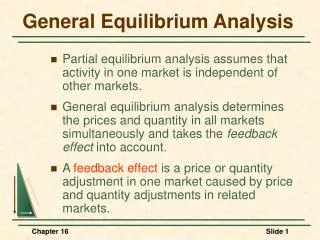
Partial vs. General equilibrium analysis • Analysis conducted in previous chapters = Partial equilibrium analysis. • Determine equilibrium prices and quantities independent of effects from other markets • General equilibrium model takes account of interrelationships between various sectors in the economy. • Simultaneous determination of the prices and quantities in all relevant markets, taking feedback effects into account.
Two interdependent markets – Moving to General Equilibrium • Figure 16.1 page 587
Efficiency in exchange • Exchange economy: • Market in which two or more consumers • Trade two goods amongst themselves • Efficient allocation: • Allocation of goods • in which no one can be made better off • unless someone is made worse off. • Economy with • 2 people (Adam & Eve) • 2 commodities (Apples & Figs) • Fixed supply of commodities (e.g., on a desert island)
Efficiency in exchange • RULE: • An efficient allocation of goods are distributed • So that the MRS between any pair of goods • Is the same for all consumers • An Edgeworth Box depicts the distribution of goods between the two people. • All possible allocations of two goods between two people • Or of two inputs between two production processes
Edgeworth Box • Page 592
Exchange economy • Each point in the box represents an allocation between Adam and Eve. • Each point in the box fully exhausts the resources on the island. Adam consumes what Eve doesn’t. • Adam’s consumption of apples and figs increases as we move toward the northeast in the box. • Eve’s consumption of apples and figs increases as we move toward the southwest in the box. • At point v in the figure, Adam’s allocation of apples is Ox, and of figs is Ou. Eve consumes O’v of apples, and O’w of figs.
Exchange economy • Assume that Adam and Eve each have conventionally shaped indifference curves. • Adam’s happiness increases as he consumes more; therefore his utility is higher for bundles toward the northeast in the Edgeworth Box. • We can therefore draw “standard” indifference curves for Adam in this picture. Adam would get even higher utility by moving further to the northeast, outside of the Edgeworth Box, but he is constrained by the resources on the island.
Exchange economy • Similarly, Eve’s happiness increases as she consumes more; therefore her utility is higher for bundles toward the southwest in the Edgeworth Box. • Eve’s indifference curves therefore are “flipped around.” Her utility is higher on E3 compared E2 or E1.
Pure exchange economy • Suppose some random point in the Edgeworth Box is selected, for example point g in figure 2 • This provides an initial allocation of goods to Adam and Eve, and thus some initial level of utility.
Exchange economy • We can now pose the following question: Is it possible to reallocate apples and figs between Adam and Eve to make Adam better off, while Eve is made no worse off? • Allocation h in Figure 3 is one possibility. We are “moving along” Eve’s indifference curve, so her utility remains unchanged. Adam’s utility clearly increases. • Clearly, other allocations achieve this same goal, such as allocation p. • Once we reach allocation p, we cannot raise Adam’s utility any more, while keeping Eve’s utility unchanged.
Pareto efficient • An allocation is Pareto efficient if the only way to make one person better off is to make another person worse off. • Often used as the standard for evaluating desirability of an allocation of resources. • Pareto inefficient allocations are wasteful. • A Pareto improvement is a reallocation of resources that makes one person better off without making anyone else worse off.
Pareto efficiency • Many allocations are Pareto efficient. Figure 4 illustrates three of them -- allocations p,p1 and p2. • Among these Pareto efficient allocations, some provide Adam with higher utility than others, and the opposite ones provide Eve with higher utility.
Pure exchange economy • In fact, there are a whole set of Pareto efficient points in the Edgeworth Box. • The locus of all the set of Pareto efficient points is called the contract curve.
Pareto efficiency • Page 594
Exchange economy • Figure shows that each of the Pareto efficient points is where an indifference curve of Adam is tangent to an indifference curve of Eve. • Mathematically, the slopes of Adam’s and Eve’s indifference curves are equal.
Exchange economy • The slope of the indifference curve indicates the rate at which the individual is willing to trade one good for another, know as the marginal rate of substitution (MRS). • Pareto efficiency requires:
Production economy • In pure exchange economy, assumed supplies of commodities were fixed. • Now consider scenario where quantities can change. • The production possibilities curve/frontier shows: • Combinations of two goods • That can be produced with fixed quantities of inputs.
Production economy • For apple production to be increased, fig production must necessarily fall. • The marginal rate of transformation (MRT) of apples for figs (MRTaf) shows the rate at which the economy can transform apples to fig leafs. • It is the absolute value of the slope of the production possibilities curve. • The marginal rate of transformation can be written in terms of marginal costs:
Efficiency with variable production • With variable production, efficiency requires: • If this were not the case, it is possible to make one person better off with an adjustment production. Rewriting in terms of marginal costs, we then have:
Output efficiency • Efficient economy: • Produce at minimum cost • Produce in combination that match people’s wiliness to pay for them. • MRS test willingness to pay • MRS = MTS
Output efficiency • Page 604
Competition and Output efficiency • Page 605
The efficiency of competitive markets • General equilibrium and economic efficiency complete: • Initial allocation of resources = competitive process of exchange among individuals = economic efficient outcome. • With convex indifference curves = efficient allocation of resources achieved by a competitive process with suitable distribution of resources
The efficiency of competitive markets • Thus two theorems of welfare economics: • Will achieve efficient allocation of resources • Issues of equity and efficiency can be treated distinctly from each other.
Understanding the workings of the competitive process • Efficiency in exchange • Efficiency in the use of inputs in production MRTSLK = MRTSLK • Efficiency in the output market
Why markets fail • Market Power • Inefficiency arise • Incomplete information • Inaccurate in formation on price and quality • Externalities • When market prices doesn’t reflect all producers and consumers • Public Goods • Nonexclusive, nonrival good that can be made available cheaply but which is difficult to prevent others from consuming