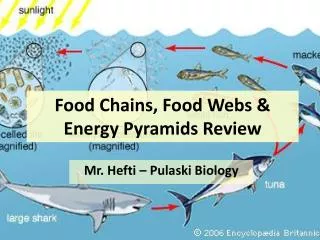
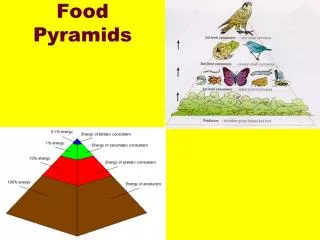
Food Pyramids
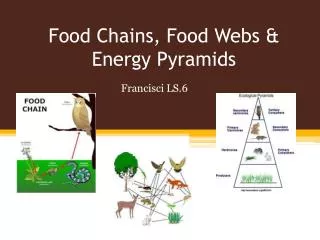
Food Pyramids. Food Pyramid = Diagram showing each trophic level as a horizontal bar. Producers are located on bottom Higher trophic levels are placed on top of each other. Each bar is drawn in proportion to the mass of organisms giving the triangle shape.

Food Pyramids
E N D
Presentation Transcript
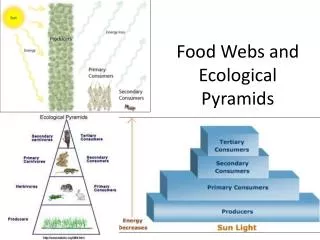
Food Pyramid = • Diagram showing each trophic level as a horizontal bar. • Producers are located on bottom • Higher trophic levels are placed on top of each other. • Each bar is drawn in proportion to the mass of organisms giving the triangle shape.
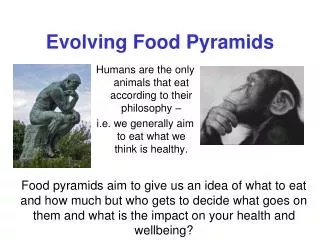
Why are there fewer organisms at each trophic level? • As you go up the food chain, less energy is available at each higher level. (1/10th of lower level). • Organisms higher up have to eat more food from lower levels to survive. • Therefore, fewer organisms can obtain energy to live. • Hence, fewer organisms are at each higher level. If humans became primary consumers only, then more of the human population could be supported.
Higher means Less! The higher up you go, there is less: • Mass of organisms – food pyramid • Number of organisms – pyramid of numbers • Amount of energy – energy pyramid
Biological Amplification • Biological Amplification is the tendency of pollutants/toxins to become more concentrated in higher trophic levels. • Often, this is to the detriment of the organisms in which these materials concentrate, since the pollutants are often toxic. • Also referred to as Biological magnification
Biological Amplification – simplified! • FACT! - Some toxins (DDT & mercury) are stored in fat and are NOT water soluble or excreted. • Plants/organisms at lower levels take in toxins. • Animals higher up eat many of these lower organisms to obtain enough energy. • Toxins will tend to build up and be in much higher concentrations in these higher up consumers.
How do food pyramids help explain DDT amplification? • DDT was a particularly dangerous toxin because it is fat soluble and stays in an animal's fat. (Some poisons are water soluble and can be excreted from the system.) • Lower order organisms ingest some poison which is stored in their fat. • Higher order organisms eat large numbers of lower order organisms. (Ex. A small amount in a frog becomes large in a hawk that eats 100 frogs.)
the introduction of chinch bugs when it arrived through sods imported from mainland Canada? the introduction of snowshoe hare or even the moose to the island of Newfoundland? Introduction of new species? • What could be the probable impact that: • the recent arrival of coyotes on the island of Newfoundland may have on the local ecosystem?
Possible Effects ??? • Elimination/disruption of their food sources/species. • Competition for food sources may cause decline or endanger other native species that eat same food source. • Diseases may be introduced causing decline or disruption. • May cause interruption or decline in economic activity related to lost/declining species. (ex. Moose & Caribou) • Financial cost to subsequently control new species.