Download

1 / 37
380 likes | 592 Views
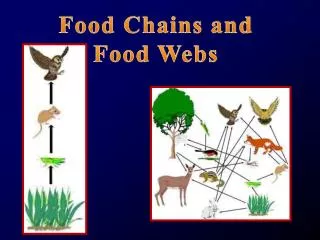
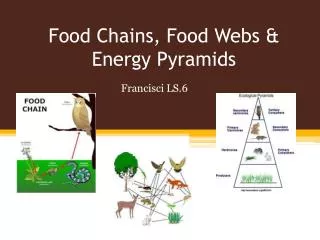
Food Webs and Pyramids. Food Chains. Nutrients and energy flow through ecosystems in food chains and food webs. A food chain is the flow of energy from one organism to another. The arrows in a food chain represent the energy flow ! Here is an example……. Trophic Levels.

E N D
Food Chains • Nutrients and energy flow through ecosystems in food chains and food webs.
A food chain is the flow of energy from one organism to another. • The arrows in a food chain represent the energy flow! • Here is an example……
Trophic Levels • Contains all organisms in a feeding level that are the same number of steps away from the sun. • Moving up each trophic level, there is a 90% loss of heat.
That means that only 10% of energy is passed along from one level to another.
Because of the huge loss of energy, there is usually no more that 4 or 5trophic levels.
VOCABULARY • 1. Autotroph (producer) – Organisms that can make its own food. • 2. Heterotroph (consumer) – Organisms that relies on other organisms for food
3. Primary consumer – the first consumer that eats the producer • 4. Herbivore – organisms that eat only PLANTS
5.Secondary consumer – second level consumer that eats a first level consumer • 6.Tertiary consumer – third level consumer
7. Carnivore – organisms that eat only MEAT • 8. Omnivore – Organisms that eat both PLANTS and ANIMALS
9. Decomposer (saprophyte) – type of bacteria or fungus that breaks down dead organisms and wastes
10.Detritivore (detritus feeder) – organisms that shred and consume already dead organisms and matter (other than bacteria and fungi).
FOOD WEBS • Interconnecting food chains • Gives us a better picture of the ecosystem
Keystone Species • A species that has a strong or wide-reaching impact on a community is called a keystone species.
If the keystone species is removed, the community will collapse and alter a large portion of the food web.
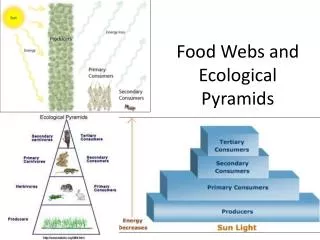
Ecological Pyrmaids • Graphic way to represent the relationship energy values in each tropic level.
Higher trophic levels are layered on top of one another. The source of energy for these pyramids is the sun.
TYPES OF PYRAMIDS • Pyramid of Energy • Pyramid of Numbers • Pyramid of Biomass
PYRAMID OF ENERGY • Illustrates the energy content of biomass of each tropic level. • Energy expressed in kilocalories/square meters.
Larger at the bottom and gets progressively smaller. • Shows that most of the energy dissipates at the lower levels
The energy lost in each successive trophic level is heat that enters the environment. • Energy pyramids explain why there are fewtrophic levels.
No biological process is 100% efficient. There will be unusable energy.
PYRAMID OF BIOMASS • Illustrates the total biomassat each trophic level.
Biomass is a quantitative estimate of the total mass or amount of living material. • Biomass units vary. It can be represented by total volume or live weight.
Assumption – There is on the average a 90% reduction of biomass for each trophic level.
Biomass is calculated by finding the average weight of an organism of each species at that trophic level and then multiplying by the estimated number of organisms in eachpopulation.
Although carnivores do not eat a lot of producers, it takes a lot of producers to support them.
PYRAMID OF NUMBERS • This pyramid is based on the number of organisms at each level.
Not as useful as the other pyramids because it provides no information about energy levels or biomass.
Inverted pyramid of numbers – higher trophic level organisms have more than lower trophic levels.
Blue birds INVERTED PYRAMID OF NUMBERS