Download
1 / 47
470 likes | 588 Views
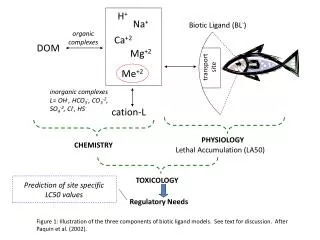
This workshop presentation explores the accuracy and protective capabilities of the Biotic Ligand Model (BLM) in predicting copper toxicity across various water hardness levels. Emphasizing the need for less stringent effluent limits in low hardness waters, the talk outlines how BLM can inform wastewater treatment plants to propose appropriate copper limits. The data discussed highlights the relationship between dissolved organic carbon (DOC) and copper toxicity, stressing the importance of accurate data quality in environmental assessments and regulatory compliance.

E N D
The accuracy and protectiveness of Biotic Ligand Model (BLM) toxicity predictions with copper Christopher A. Mebane U.S. Geological Survey, Boise, Idaho, USA Workshop on Biotic Ligand Model Principles and Applications Wilfrid Laurier University, Waterloo, Ontario, Canada May 12-14, 2008 All analyses and data summaries shown in this talk are provisional and subject to revision
March , # 2 In the States, It’s not just a model, it’s the law... At least, national criteria issued pursuant to the law.
BLM promoted to provide less stringent effluent limits “Using the new [BLM-based copper] criteria effectively” “It is expected that the BLM-based criteria will be less stringent in low hardness waters, but possibly more stringent in harder waters. Therefore, wastewater treatment plants discharging into waters with low hardness, especially with high dissolved organic carbon, should consider performing a BLM and proposing alternative copper effluent limits as appropriate.” http://www.cdm.com/knowledge_center/monthly_viewpoint/epa_copper_criteria.htm (viewed April 29, 2008)
Yukon River at Eagle, Alaska USGS Photo
Yukon River USGS Photo
Columbia River between Northport, WA and Trail, BC Uncredited photo, www.city-data.com
Northwestern soft water salmon stream, Big Soos Creek, WA Photo King County Department of Parks and Natural Resources
Extremely soft water stream North Fork Coeur d’Alene River at Enaville, Idaho, Hardness 11-23 mg/L, DOC 0.8 to 1.1 mg/L USFS Photo
Snake River leaving Yellowstone National Park, Wyoming (hardness 25-60 mg/L, pH 7 to 8.5, DOC 0.9 to 4.5 mg/L)
Copper contaminated western mountain stream, Panther Creek, Idaho (DOC 1.1 to 4.6 mg/L, hardness 25-50, pH 7.5 to 8.6) Data from Stratus Consulting
Copper and DOC concentrations rose together during early snowmelt Data from Stratus Consulting
DOC and pH data quality are important! What’s happened in September 93?
Beware USGS DOC data prior to 1994! Columbia River between Northport, WA and Trail, BC
Assuming DOC as 1.1 mg/L, HydroQual’s 2003 LA50 of 7.32 (DOC not measured) Assuming DOC as 1.35 mg/L, EPA’s 2003 LA50 of 3.56
LA50 7.32, no Mg, April 2003 DOC 100% reactive as 90% FA, 10% HA Photo courtesy of Paul Welch Fathead minnows in low alkalinity Precambrian Shield Lakes (Data from Welsh et al., 1993).
DOC 100% Cu-reactive LA50 5.48, includes Mg, (6-10-2007) (default) DOC 50% Cu-reactive LA50 6.313, no Mg (Recalculated from EPA 2003)
Fathead minnows in low alkalinity South Carolina piedmont streams (VanGenderen et al., 2005). Model LA50: 7.32 nmol Cu/g gill Modified LA50: 0.2 nmol Cu/g gill
Using EPA’s 2003 updated dataset and assuming 50% of DOC is Cu-reactive (data from VanGenderen et al., 2005). (top) DOC 50 % Cu-reactive,LA50: 6.313 nmol Cu/g gill (bottom) DOC 100% Cu-reactive,LA50: 0.2 nmol Cu/g gill
< 0.3mm Fatmucket, Lampsilis siliquoidea Acute tests in waters with variable hardness and different DOC sources Data from Ning Wang, USGS, Columbia, Missouri, et al., in prep., Photos by Doug Hardesty, USGS
Fatmucket A. Assume DOC is 100% reactive as 90% FA, 10% HA, (LA50 0.0605 nmol Cu/g gill) B. Assume DOC is 50% reactive as FA ((LA50 0.1916 nmol Cu/g gill) B. A.
Fatmucket mussel: hardness vs. BLM as predictor of toxicity y = 0.96x - 0.207 r2 = 0.9 P <0.001 (pooling all groups) y = 0.37x +27.2 r2 = 0.05 P =0.2 (pooling all groups) 95% prediction bands
Ceriodaphnia dubia ~25 natural waters, Mostly hardwater, (17-185 mg/L CaCO3), DOC 0.8 to 30 mg/L GLEC, 2006 (Tyler Linton) Escanaba River, Michigan photo, wikipedia.org
Escanaba River, Michigan photo, wikipedia.org Ceriodaphnia dubia DOC 100% Cu-reactive LA50 0.0701, includes Mg, (6-10-2007) (default) DOC 50% Cu-reactive LA50 0.2378, no Mg (Recalculated from EPA 2003)
Hyalella azteca Doug Hardesty, USGS
Rainbow trout flow-through tests using natural and lab waters, DOC <0.11 to 2.0 mg/L. Welsh, Lipton, and Maest, (Stratus Consulting) Assume DOC is 100% reactive as 90% FA, 10% HA Assume DOC is 50% reactive as FA < Josh Lipton, Stratus Consulting
Chinook salmon flow-through tests using natural and lab waters, DOC 0.11 to 1.4 mg/L. Welsh, Lipton, and Maest, (Stratus Consulting) Assume DOC is 100% reactive as 90% FA, 10% HA Assume DOC is 50% reactive as FA Josh Lipton, Stratus Consulting
Rainbow trout, renewal exposures Assume DOC is 50% reactive as FA BLM Predicted vs. observed rainbow trout LC50s, in renewal tests using lab and site waters, hardwater, DOC from <1 to 11 mg/L, 3 of 4 seasonal rounds of testing (all data from the 1st of 4 rounds discarded for questionable DOC data). ENSR. 1996. Development of site-specific water quality criteria for copper in the upper Clark Fork River: Phase III WER Program testing results. ENSR Consulting and Engineering, 0480-277, Fort Collins, Colo. Assume DOC is 100% reactive as 90% FA, 10% HA
Some Bad News Testing DOC “equivalents” that matched natural DOM for binding affinity and complexation. DOC equivalents ranged O.3 to 16 mg/L, (actual DOC mass 0.11 to 0.84 mg/L) in lab water of with hardness of 24 mg/L CaCO3, Marr et al 1999, Panther Creek DOC Rainbow trout 96h LC50s, uniform total hardness with varying Ca and Mg, uniform low DOC, Welsh et al 2000
Chronic EC10s Rainbow trout (30-120d growth) • Besser et al, 2005 • Hansen et al, 2002 • Marr et al., 1996 • Seim et al. 1984 Brook trout (2-22 months) • McKim et al. 1971, 1974 • Sauter et al. 1976 Fathead Minnow (21-days to 11 months) • Mount 1968 • Welsh 1996 • Besser et al. 2005 Chinook salmon, 120d (treated as a rainbow trout) • Chapman 1982
Reductions in the olfactory response to a natural odorant (serine) following short-term (30 min) exposure to 20 µg/L dissolved copper (McIntyre et al., ES&T, 2008) Photo: Carla Stehr, National Marine Fisheries Service, Seattle
Shayler Run, Ohio, USA • Stream experimentally dosed with copper, 1968-1972 • Integrated long-term field, streamside, and laboratory toxicity studies • High calcium limestone geology • DOC from natural and sewage sources Geckler and others, 1976. Validity of laboratory tests for predicting copper toxicity in streams. EPA 600/3-76-116 Photo from Geckler and others, 1976
BLM chronic criterion Safe from adverse effects (range) BLM and field effects –Ohio Stream • Threshold for adverse effects from • Full life cycle streamside toxicity tests with native fish • Fish behavioral changes in stream Cu (µg/L)
Convict Creek, California, USA • Sierra Nevada stream experimentally dosed with copper for 1 yr • Measured effects on stream metabolism and macroinvertebrate community • Low calcium granitic geology • Most BLM parameters measured – except DOC • Single DOC site value of 3.7 mg/L; average DOC in High Sierra Lakes estimated at 1.8 mg/L. Photo courtesy of Daniel Dawson, Sierra Nevada Aquatic Research Laboratory
BLM and field effects - Sierra Nevada stream Copper (µg/L) Sources: Leland and Carter, Freshwater Biology, 1984, 1985, 1989 Brooks and others, Ecosystems, 2005 1979 1980
Macroinvertebrate exposures in August 1987, no DOC data. 1997 pH and inorganic data similar, assuming DOC is similar Clements et al., CJFAS., 1988 Clements et al., Aq. Tox., 1989 New River near Blacksburg, VA, New River Valley Bird Club BLM and experimental streams
30 week aquatic microcosm experimentS.F. Hedtke, Aquatic Tox., 1984
I think I learned ... • BLM performed well across a broad range of waters and with diverse taxa • Paucity of chronic toxicity data from varied waters. Chemosensory testing valuable, esp. tests of whether effects are ecologically relevant • Experimental stream studies could be compelling • BLM too sensitive to DOC? Assuming 100% of DOC is Cu-reactive may be a factor. Overprotective at low DOC and underprotective higher DOC. • Assuming 50% of DOC is Cu-reactive fulvic acid improved predictions in most datasets from natural waters. No datasets were made much worse by the 50% AFA assumption. • Adding Mg to the model not helpful in these datasets. Perhaps limit to site-specific situations where Mg is important. • Emphasis on equilibrating waters in FT tests seems misplaced. • Quality of DOC and pH measurements critical. Recommend DOC detection to at least 0.3 mg/L in field data, 0.1 if testing synthetic waters