Download
1 / 7
70 likes | 173 Views
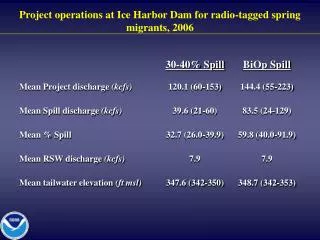
Analyzing fish migration at Ice Harbor Dam in 2006 using different spill percentages and turbine operations to study passage and survival rates of Chinook and Steelhead. The data includes flow rates and specific turbine and spill bay configurations.

E N D
Project operations at Ice Harbor Dam for radio-tagged spring migrants, 2006
23.8% 22.1% 18.3% 11.1% First approach and passage distribution: 30-40% Spill Percent of fish RSW Bypass Turbine 2 Turbine 3 Spill bay 1 Spill bay 6 Turbine 1 Turbine 4 Turbine 5 Turbine 6 Spill bay 3 Spill bay 5 Spill bay 7 Spill bay 9 Spill bay 4 Spill bay 8 Spill bay 10 Flow
46.2% 49.2% 29.8% 19.5% First approach and passage distribution: BiOp Spill Percent of fish RSW Bypass Turbine 2 Turbine 3 Spill bay 1 Turbine 1 Turbine 4 Turbine 5 Turbine 6 Spill bay 3 Spill bay 5 Spill bay 7 Spill bay 9 Spill bay 4 Spill bay 6 Spill bay 8 Spill bay 10 Flow