Download
1 / 68
680 likes | 791 Views
Explore the symmetrical patterns in market data, revealing how time duration affects price changes and performance rankings. Discover the influence of news, fundamentals, and sentiment on stock patterns across various time frames.

E N D
Market Technicians Association, Inc. 61 Broadway, Suite 514. New York, NY 10006 Web: www.mta.org Phone: 646-652-3300 Fax: 646-652-3322 The 2011 OutlookMukul Pal, CMT
Vilfredo Pareto(1848-1923)Father of Microeconomics Who saw the curve?
80-20 Price and Time 20% Time, 80% price change 80% Time, 20% price change
Exponentiality Exponential Symmetry
Sub divisions Counting Elliott did not know Fibonacci 5 3 e 1 4 c d 2 a e b c d a e c b a d b
80-20 Price and Time 20% Time, 80% price change 80% Time, 20% price change
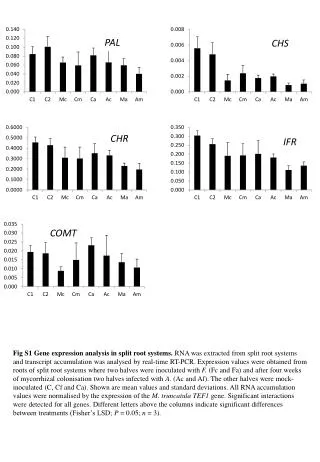
Analysis When we look at time duration for the 23 stocks we find most distributions to have an exponential nature. Our results are based on analyzing ≈ 5000 time duration data points representing rate of change inflexion around a mean value of 1 over the daily data ≈ 50,000 price data points for the period January 2000—October 2010. Figure 2 displays the ascending sequence of the time duration data. We observe that the distribution has an exponential form and decay. P(g) ~ e−βg With β = 2.4 ± 0.037
Market Influences • News • Fundamentals • Demand and Supply • Technical Analysis • Sentiment
Top 10 – 1D Romania
Top 10 – 5 day India
Pattern • Chance • Where is the pattern? • Is curve a pattern? • Is the curve mathematical?
A week • Umm.. • Ok I see it • It’s a curve • It looks similar on two degrees of time • Did any news came this week?
Few weeks • It’s repeating • A similar curve. • There was news, demand, supply • Technicals and fundamentals
Few months • wow • How is this happening? • Nothing changes it • News, demand, supply, technicals, fundamentals • Mysterious force
Year • Pattern continues despite all market influences.
Region, Sector • Pattern in the region • Pattern in a sector
Region, Sector, America • Pattern in the region • Pattern in a sector • Pattern in America
Region, Sector, America, in time • Pattern in the region • Pattern in a sector • Pattern in America • Across degrees of time
S&P500 – 1d Southwestern Energy Company (SWN.N) Citrix Systems, Inc. (CTXS.OQ)
S&P500 – 5d Host Hotels & Resorts, Inc. (HST.N) Coca-Cola Enterprises Inc. (CCE.N)
S&P500 – MTD Marathon Oil Corporation (MRO.N) Coca-Cola Enterprises Inc. (CCE.N)
S&P500 – 1M Carnival Corporation (CCL.N) Coca-Cola Enterprises Inc. (CCE.N)
S&P500 – 3M Genzyme Corporation (GENZ.OQ) Micron Technology, Inc. (MU.OQ)
S&P500 – 6M Teradata Corporation (TDC.N) Office Depot
S&P500 – YTD Genzyme Corporation (GENZ.OQ) H&R Block, Inc. (HRB.N)
S&P500 – 1Y Dean Foods
What is this pattern? • It’s a curve • Exponentiality • Small Big gains • Small Big loss • Lot of sideways action • It’s a cycle • Show me the cycle?
Region, Sector, America, in timeall over • Pattern in the region • Pattern in a sector • Pattern in America • Across degrees of time • Across universe of stocks
What does the curve mean? • Performance is ordered • Performance is cyclical • Performance is cyclical across time frames • Stocks move up and down in performance • They outperform and underperform in an ordered sequence • The sequence is a pattern of Time • Time is exponential • Time is the real price