Environmental Science Chapter 4: Population Ecology
340 likes | 559 Views
Environmental Science Chapter 4: Population Ecology. February 3, 2014- SIGN IN. Get an environmental science book (FROG on it) Do the following questions…DO NOT WRITE the question, only the answers Page: 89 questions: 1,2,3 Page : 94 questions: 23,24,25 Page : 103 questions: 1,2,3

Environmental Science Chapter 4: Population Ecology
E N D
Presentation Transcript
February 3, 2014- SIGN IN • Get an environmental science book (FROG on it) • Do the following questions…DO NOT WRITE the question, only the answers • Page: 89 questions: 1,2,3 • Page : 94 questions: 23,24,25 • Page : 103 questions: 1,2,3 • Page : 109 questions: 1,3,4 • Page : 117 questions: 1,2,3
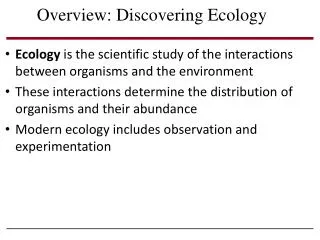
What is ecology? • The study of how organisms interact with each other and with their environments WRITE WRITE
Defining an ecosystem • Ecosystem: all the organisms living in an area together • Forest Ecosystem • Pond Ecosystem • Vacant Lot Ecosystem • Desert Ecosystem WRITE WRITE
All Ecosystems are connected How does your ecosystem impact the Atlantic Ocean? DO NOT WRITE DO NOT WRITE
Parts of an ecosystem In order for an ecosystem to survive there must be certain basic parts • Energy • Mineral nutrients • Carbon dioxide • Water • Oxygen and more WRITE WRITE
WRITE WRITE
Biotic vs. Abiotic Biotic: living parts of the ecosystem • Plants, animals, bacteria, etc. Abiotic: nonliving parts of the ecosystem • Sunlight, soil, air, temperature WRITE WRITE
Organizing Biotic Parts DO NOT WRITE DO NOT WRITE
Smallest Unit Organism: an individual living thing like you, a tree, a fox, a rose Species are groups of organisms WRITE WRITE
Species Species: groups of organisms that resemble each other in appearance, behavior, chemistry and genetic makeup…able to reproduce • 3.6 to 100 million species (1.4 identified) WRITE WRITE
Population Population: all the members of the same species that live in the same place at the same time WRITE WRITE
Community Community: a group of various species that live in the same place and interact with each other. WRITE WRITE
Ecosystem • Ecosystem: all the organisms living in an area together WRITE WRITE
Biosphere • All parts of the Earth where life is found WRITE WRITE
Habitat • Habitats provide an organism with resources—anything an organism needs to survive and reproduce, including food, shelter, and mates. WRITE WRITE
Review: What is a population? Population: all the members of the same species that live in the same place at the same time • Field mice living in a corn field, grizzly bears of Yellowstone Park area Wolves in Yellowstone NP
Population Size • Why care about the size of the population? • How can scientists estimate the population (say of Elephant Seals on a beach in CA)? WRITE WRITE
Population Size • The number of individuals in a population at a given time • Sudden and dramatic decreases in population size can indicate an unhealthy population headed toward extinction. • Ecologists often use sampling techniques to estimate population size. WRITE WRITE
Estimating Population How can you estimate the population of trees in this valley? WHY NOT COUNT THEM ALL? WHY IS SAMPLING NEEDED?
Population Density • Measure of how crowded a population is • Larger organisms generally have lower population densities. • Low population density: More space, resources; finding mates can be difficult • High population density: Finding mates is easier; tends to be more competition; more infectious disease; more vulnerability to predators WRITE WRITE
Population Distribution How organisms are arranged within an area: WRITE WRITE RANDMOM CLUMPED UNIFORM Occurs where resources needed are found throughout, wildflowers in meadow Most Common. Occurs where resources are together. Water hole in desert, humans in cities Occurs when individuals hold territory or compete for space. Plants in desert
Population Distribution • Uniform distribution: Organisms evenly spaced • Random distribution: Organisms arranged in no particular pattern • Clumped distribution: Organisms grouped near resources; most common distribution in nature WRITE WRITE
Sex Ratios • Proportion of males to females • Age structure diagrams give information about sex ratios. • For a monogamous species, the ideal sex ratio is 50:50. WRITE WRITE Why is 50/50 not as important in non-monogamous populations?
Survivorship • Individuals of different ages have different probabilities of dying • Survivorship curves show how the likelihood of death varies with age. WRITE WRITE
Type I survivorship curves are for species that have a high survival rate of the young, live out most of their expected life span and die in old age. Humans are a good example of a species with a Type I survivorship curve WRITE WRITE Type II survivorship curves are for species that have a relatively constant death rate throughout their life span. Death could be due to hunting or diseases. Examples of species exhibiting a Type II survivorship curve are coral, squirrels, honey bees and many reptiles.
Type III survivorship curves are found in species that have many young, most of which die very early in their life. Plants, oysters and sea urchins are examples of species that have Type III survivorship curves. WRITE WRITE
Patterns of Growth WHAT SHAPE DOES EXPONENTIAL GROWTH LOOK LIKE? EXPONETIAL GROWTH • Population increases by a fixed percentage every year. • Normally occurs only when small populations are introduced to an area with ideal environmental conditions • Rarely lasts long WRITE WRITE Starts slowly, then takes off – “J-Shaped Curve”
WRITE WRITE
Limiting Factors Limiting Factor Principle:too much or too little of any abiotic factor can limit or prevent growth of a population, even if all other factors are near or above optimum. WRITE WRITE
Carrying Capacity Limiting Factors lead to Carrying Capacity: the largest population an environment can sustain. WRITE WRITE
Biotic Potential • An organism’s maximum ability to produce offspring in ideal conditions • Many factors influence biotic potential, including gestation time and generation time. • Organisms with high biotic potential can recover more quickly from population declines than organisms with low biotic potential. WRITE WRITE
Class work Open Book to page 122 Answer questions 17-23 25-26
Bellringer Open Book to page 123 Answer question number 32