Download
1 / 26
260 likes | 416 Views
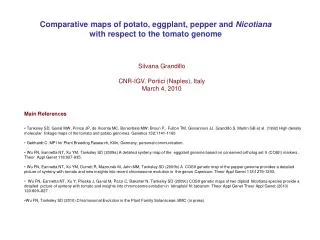
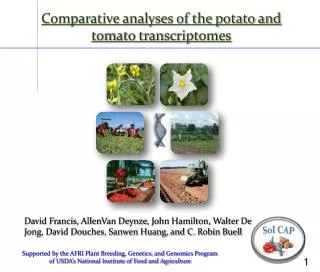
Comparative analyses of the potato and tomato transcriptomes. David Francis, Allen Van Deynze , John Hamilton, Walter De Jong, David Douches, Sanwen Huang, and C. Robin Buell.

E N D
Comparative analyses of the potato and tomato transcriptomes David Francis, AllenVan Deynze, John Hamilton, Walter De Jong, David Douches, Sanwen Huang, and C. Robin Buell Supported by the AFRI Plant Breeding, Genetics, and Genomics Program of USDA’s National Institute of Food and Agriculture
Questions International Sol Project: How can a common set of genes/proteins give rise to such a wide range of morphologically and ecologically distinct organisms? SolCAP: How can variation be harnessed to improve varieties that benefit the consumer, processors, and the environment? Sequence data available to address these questions: S. phureja draft genome sequence S. tuberosum, S. lycopersicum, S. pimpinellifolium GAII transcriptomes Technology Next Generation Sequencing SNP genotyping
What comparisons do we want to make? How well do S. tuberosum expressed sequences align to S. phureja genomic sequences? How well do S. lycopersicum expressed sequences align to S. phureja genomicsequences? How is variation distributed within a Species? within a market class? within a variety? within a gene? Which sequence variation is important to phenotypic variation?
Library creation/QC GAII sequencing (single and paired end) 400 300 Data Collection Assembly Analysis: transcriptome complexity SNP calling/validation identification of genes under selection
Velvet Assemblies of Potato Illumina Sequences • With a minimum kmer of 31 and a minimum contig length of 150bp:
Velvet Assemblies of Potato Illumina Sequences Alignment of the S. tuberosum GAII-transcriptome contigs to the PGSC draft genome sequence from S. phureja : • Atlantic: • 45214 contigs • 32520 align with GMAP(95%id, 50%cov) • 27106 align with GMAP(95%id, 90%cov) • Premier: • 54917 contigs • 41497 align with GMAP (95%id, 50%cov) • 37297 align with GMAP (95%id, 90%cov) • Snowden: • 58754 contigs • 44479 align with GMAP (95%id, 50%cov) • 40708 align with GMAP (95%id, 90%cov)
Velvet Assemblies of TomatoIllumina Sequences • With a k-mer length of 31 and a minimum contig length of 150bp:
Sequence quality: Viewing an Atlantic potato contig from the Velvet assembly
Alignment of contigs relative to S. phureja FL7600 (93.7 % id; 94.4 % coverage) Snowden (97.9; 94.7)
Identify intra-varietal SNPs A/C SNP
Filtered SNP counts Filtering on SNP quality and 1 SNP/ 150bp window
Genotyping platforms…. Comments on quality control… Data…. direct comparison of sequence analysis of SNPs across populations
COS R-gene Comparison of two genes on tomato chromosome 9 BAC
COSII Fresh Market vs Fresh Market Identities = 573/573 (100%), Gaps = 0/573 (0%)Fresh Market vs Processing Identities = 569/569 (100%), Gaps = 0/569 (0%)S. lycopersicum vs S. pimpinellifolium Identities = 339/341 (99%), Gaps = 0/341 (0%)Potato vs Potato Identities = 606/612 (99%), Gaps = 0/612 (0%)Tomato vs Potato Identities = 914/948 (96%), Gaps = 6/948 (0%)
DIVERGED SEQUENCE Fresh Market vs Fresh Market Identities = 959/959 (100%), Gaps = 0/959 (0%)Fresh Market vs Processing Identities=1560/1560(100%), Gaps=0/1560 (0%)S. lycopersicum vs S. pimpinellifolium Identities = 612/613 (99%), Gaps = 0/613 (0%)Tomato vs Potato Identities = 223/280 (79%), Gaps = 11/280 (3%)Potato vs Potato Identities = 246/278 (88%), Gaps = 7/278 (2%)
What patterns do we expect to see for genes “under selection”? • Low Variation (fixed) • High Ka/Ks (mutations affect protein, possible diversifying selection) • Mutations (loss of function) • FST (genes that distinguish populations)
Population structure: coding vs. non-coding Processing Fresh-market Vintage Landrace All 173 markers (K=6) CA & OH OH CN 89 Coding markers (K=5) 84 Non-coding markers (K=6) CA OH OH CN 500K burnin/750K MCMC reps, 20 runs for each K from 3 to 8
Distribution of FST for genes ovate: 0 fw2.2: 0 sp6: 0.14 ovate: 0.26 fw2.2: 0 sp6: 0.73 ovate: 0.14 fw2.2: 0.46 sp6: 0.05 ovate: 0 fw2.2: 0.5 sp6: 1 ovate: 0 fw2.2: 0.42 sp6: 0.74 ovate: 0.31 fw2.2: 0 sp6: 0.47
Examples of highly polymorphic genes within S. lycopersicum Note: I am working on a replacement that compares Ka/Ks for selected tomato and potato genes
Examples of highly polymorphic genes within S. lycopersicum Note: I am working on a replacement that compares Ka/Ks for selected tomato and potato genes
Distribution of PM genes across populations is not random Processing Fresh Market Vintage Wild
Conclusions ~5.7 Gb PF potato transcriptome sequence (3 varieties) ~14.3 Gb PF tomato transcriptome sequence (6 varieties) S. phureja draft genome is an excellent scaffold for potato and tomato GAII transcriptome alignments SNPs are not evenly distributed in genes Genes with signatures of selection (Ka/Ks; high FST) tend to be genes associated with response to abiotic and biotic stress. Breeders have selected for groups of genes suggesting that co-adapted complexes
Acknowledgments Collaborators, Cornell Walter de Jong Lucas Mueller Joyce van Eck Collaborators, CAU Wencai Yang Collaborators, CAAS Sanwen Huang Collaborators, OSU Matt Robbins Sung-Chur Sim Troy Aldrich Collaborators, MSU David Douches C Robin Buell John Hamilton Kelly Zarka Collaborators, UCD Allen Van Deynze Kevin Stoffel Alex Kozic Funding USDA/AFRI