Download
1 / 53
530 likes | 662 Views
Long-Term Passive Microwave Observations of Soil and Vegetation Water Variability Eni Njoku Jet Propulsion Laboratory Pasadena, CA WCRP/GEWEX LandFlux Workshop Toulouse, France May 28-31, 2007. Relevant Spaceborne Microwave Sensors (Global Coverage).

E N D
Long-Term Passive Microwave Observations of Soil and Vegetation Water Variability Eni Njoku Jet Propulsion Laboratory Pasadena, CA WCRP/GEWEX LandFlux Workshop Toulouse, France May 28-31, 2007
Relevant Spaceborne Microwave Sensors (Global Coverage) • Satellite microwave radiometers viewing Earth have operated in space since the early 1970s • Only recently have they been designed specifically for soil moisture sensing (SMOS, HYDROS) * Radiometer and radar **Status as of 2004**
Earth Science Decadal Survey Report http://www.nap.edu/catalog/11820.html Missions Recommended for NASA (2016-2019 time-frame not shown)
L-Band 1.4 GHz CMIS AMSR 6.0 GHz 1.4 GHz SSM/I 19 GHz 6.0 GHz l d = 10.0 GHz 4 π n’’ l = Wavelength n’’ = Im {Refractive Index} Power Attenuates as e-z/d Effective sensing depth decreases with increasing measurement frequency Vegetation attenuation increases with increasing measurement frequency L-band provides significant improvements in soil moisture sensing capability over C- to K-band (SSM/I, TMI, AMSR-E)
(Emission) (Backscatter) Soil-Vegetation Surface Microwave Modeling Ionosphere, Atmosphere Surface (Composite soil/vegetation) Backscatter (Radar) Emission (Radiometer) • Subscripts p, q : polarization (h or v) • Lpq, Lp : one-way vegetation attenuation factor, exp(-o / cosq) • Superscripts t, s, v, and sv indicate total, soil, vegetation, and soil-vegetation interaction terms, respectively
Radio-Frequency Interference Effects TB (K): June 2004 (Mean, Descending) • Means and standard deviations of TB spectral differences have been investigated to identify 'strong' RFI • RFI spectral difference Indices: TB6.9 – TB10.7 TB10.7 – TB18.7 etc. • These indices are not robust for identifying 'weak' RFI • Caution is needed in using 6.9 GHz data (and 10.7 GHz in some locations) TB6.9 H-pol TB6.9 –TB10.7 H-pol
Reduction in Soil Moisture Sensitivity From C-to Ka-band (Can we do without C-band?) • Sensitivity to moisture in time series spanning a storm event (San Antonio, TX) • Sensitivity is greatest at 6.9 GHz, but RFI contamination is evident • 10.7 GHz provides the best/most usable signal response
Active and Passive Microwave Signatures vs. In Situ Soil Moisture QuikScat TMI In Situ
Soil Moisture(g cm-3) June 1-3, 2003 0.0 0.3 Vegetation/Roughness (kg m-2) June 1-3, 2003 8 0 TB (K) 10.7 GHz (H-pol) June 1-3, 2003 190 310 AMSR-E Soil Moisture Retrievals • Initial soil moisture algorithm used a 6.9 to 18 GHz multichannel forward-model iterative method • To avoid the RFI problem an alternate approach was implemented using primarily the 10.7 and 18.7 GHz channels • This approach retrieves a vegetation/ roughness “correction” parameter g, and the soil moisture mv
AMSR-E Retrieval Flag Classification 10 - Permanent Ice/Snow 20 - Mountainous 30 - Snow 40 - Frozen ground 50 - Precipitation 60 - RFI 70 - Dense vegetation 80 - Moderate vegetation 90 - Low vegetation Jan 2003 July 2003
AMSR-E Flood Extent Mapping Courtesy of NOAA Severe Storms Laboratory Thunderstorms occurred from central Kansas to northern Texas in early March 2004 Analysis of the AMSR-E PR change from dry conditions indicates the daily spatial extent of elevated soil moisture (06 March 2004 image at left) The image shows the observed maximum extent of retrieved soil moisture greater than 20% (vol)
AMSR-E Daily (Interpolated) Soil Moisture Extent (March 2004 Texas/Oklahoma Storm)
AMSR-E Comparisons with Reanalysis Data (NARR) Precip (CPC) vs. Soil Moisture(NARR) Soil Moisture ( AMSR-E vs. NARR) Except for a scaling factor, AMSR-E Soil Moistures show consistency with reanalysis data (NARR) in time series at some locations. However, spatial patterns of the soil moisture are often not in good agreement between AMSR-E and NARR K.-W. Jin
NASA Catchment Land Surface Model Soil Moisture (Koster, Reichle et al.) Top two layers are 2 cm and 1 m 2-cm layer soil moisture
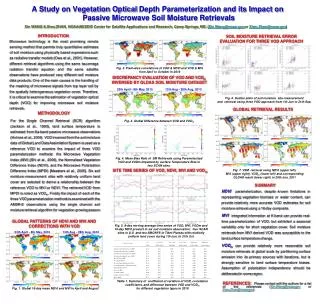
(a) Annual Mean (b) Annual Standard Deviation AMSR-E and NASA Catchment Model Soil Moisture Annual Statistics (2004) • Global maps of annual means and standard deviations of soil moisture were generated for AMSR-E and Catchment Model data • PDFs of the spatial distributions were computed for each map • (a) Top Panel: PDFs of annual mean soil moisture (2004) • (b) Bottom Panel: PDFs of annual standard deviation of soil moisture (2004) • AMSR-E retrievals show much less spread than modeled values in the annual mean and seasonal variability of soil moisture across the globe
Evolution of Soil Moisture Statistics with Changing Spatial Scale Using SWAP model (SMEX02,03,04) Mohanty et al.
Evolution of Soil Moisture Statistics with Changing Spatial Scale Using SWAP model (Arizona) 1 cm depth Mohanty et al.
Evolution of Soil Moisture Statistics with Changing Spatial Scale Using SWAP model (Arizona) 10 cm depth 10 cm depth Mohanty et al.
Evolution of Soil Moisture Statistics with Changing Spatial Scale Using SWAP model (Iowa) 1 cm depth Mohanty et al.
Evolution of Soil Moisture Statistics with Changing Spatial Scale Using SWAP model (Iowa) 10 cm depth Mohanty et al.
Conical Scan Passive Microwave Sensor Data • Data from the SMMR, SSM/I, and AMSR-E are available in common gridded format from NSIDC • Cover period from 1978 through the present - though not all channels - and instruments have different frequencies, incidence angles, diurnal sampling, spatial resolution, and revisit intervals
Single Grid Point Time-Series Data (a) 10 GHz Vertical SSM/I SSM/I SSM/I • Single-point data time series are from 10V and 37V ‘cold’ passes of SMMR, SSM/I (F08, F11, F13) and AMSR-E • Locations: • Tropical Forest - Salonga, Zaire • Ice Sheet - Dome C, Antarctica • Ocean - Indian Ocean (35°S, 90°E) • Calibration anomalies are apparent, but are mixed with geophysical effects arising from seasonal and interannual trends at the point locations • Radiative transfer modeling and in-situ data are needed to indicate how much of the observed offsets are explainable by sensor observation configuration differences Tropical Forest Brightness Temperature (K) Ice Sheet Ocean (b) 37 GHz Vertical Tropical Forest Ice Sheet Brightness Temperature (K) Ocean
Ocean-Average Time-Series Data • Six-day ocean-average brightness temperatures were generated daily, with filtering of land (~125 km from coast), sea-ice (<44°N & S), and ‘outlier’ data (95th percentile) • Shown plotted as deviations from long-term mean at 6.6/6.9 GHz and 37/36.5 GHz (SMMR/AMSR-E) • Geophysical variability (seasonal and interannual) is reduced by averaging; residual seasonal cycle can be filtered out • Calibration drifts of as little as several tenths of Kelvin can be detected against the stable ocean-average Tb background Brightness Temperature (K) Brightness Temperature (K)
First-Order SMMR TB Correction Model (Adjusting to Mean AMSR-E Levels) • Modeled relationship between AMSR-E TB and SMMR TB: where hi(f )’s and vi(f )’s are to be determined for f = 6.6, 10.7, and 18.0 GHz • Establish common “tie points” between the two datasets • Compute coefficient matrices
Site 01: Tropical forest: Boumba in S.E. Cameroon (3.5N,14.5E)
Site 02: Tropical forest: Salonga in Central Zaire (1.5S,21.5E)
Site 03: Tropical forest: Mitu in Colombia/Brazil (1.5N,69.5W)
Site 04: Tropical forest: Curua in Central Brazil (8.5S,54.5W)
Site 05: Desert: Simpson Desert in Central Australia (24.5S,137.0W)
Site 06: Desert: Kalahari Desert in S.W. Botswana (24.5S,21.0E)
Site 07: Desert: Western Desert in W. Egypt (26.5N,26.5E)
Site 08: Desert: Erg Chech Desert in W. Algeria (26.5N,2.5W)
Site 09: Boreal forest: Boreas SSA in Saskatchewan, Canada (54.0N,104.0W)
Site 10: Boreal forest: Boreas NSA in Manitoba, Canada (56.0N,98.0W)
Site 11: Boreal forest: Bonanza Creek in N. Central Alaska (64.5N,148.0W)
Site 15: Grassland: Little Washita SGP in Oklahoma (36.0N,97.5W)
Site 16: Grassland: Lonoke Farm SCAN in Arkansas (34.9N,91.9W)
Site 17: Steppe: Mongolian Plateau in S.E. Mongolia (44.5N,108.0E)
Site 18: Tundra: Toolic Lake in N. Central Alaska (68.5N,149.5W)