Download
1 / 14
140 likes | 294 Views
Kostanay Region. Region is located in the north of the country. As of January 1, 2012 the area is 196 thousand square kilometers, the region's population is 879 . 6 thousand people . Density of population over the region per 1 km is 4 . 6 people .

E N D
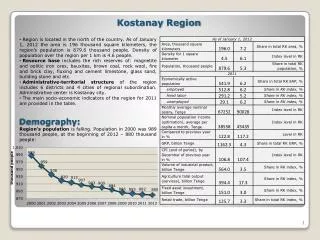
Kostanay Region • Region is located in the north of the country.As of January 1, 2012 the area is 196 thousand square kilometers, the region's populationis 879.6 thousand people. Density of population over the region per 1 km is 4.6 people. • Resource baseincludes the rich reserves of: magnetiteandoolitic iron ores, bauxites, brown coal, rock wool, fire and brick clay, fluxing and cement limestone, glass sand, building stone and etc. • Administrative-territorial structure of the region includes 6 districts and 4 cities of regional subordination. Administrative center is Kostanay city. • The main socio-economic indicators of the region for 2011 are provided in the table. Demography: Region’s populationis falling. Population in 2000 was 989 thousand people, at the beginning of 2012– 880 thousand people: 1
Economically active population (EAP) • The number of employed population increases and unemployed population falls in both absolute and relative terms. For 10 years, from 2001 to 2011, the employed population has increased from 90 to 95%, while the number of unemployed people has fallen from10to 5%. • Characteristic feature of the employed population dynamics is the growth of hired labor and the reduction of self-employed people.From 2001 to 2011 the number of hired labor grew from53% to 57%, the number of self-employed people fell from47to43%. EAP and employed population structures correspond to the average in RK: EAP is falling and in 2011 it reached 541.8 thousand people. 512.7 thousand people of these are employed, 29.1 thousand people are unemployed.Economically inactive population made up 177 thousand people, it is below the level of 2000:
The changes of employed population structure are supported by a strong tendency of unemployment rate reduction from 13.1% in 2000 to5.4% in 2011 and growth of economic activity of the population: • In 2011 unemployment rate of the region was equal to the average in Kazakhstan – 5.4%: Unemployment Level
Quality of Life • Cost of living has been growing steadily since 2003, however, the values are below the average in RK: • Life expectancy at birth in the region is increasing, but the values are below the average in Kazakhstan: • Some of life quality indicators in 2011: • Share of population with income used for consumption below the poverty line is decreasingand it is below the average in Kazakhstan:
Enrollment • Enrollment share of the population aged 6-24 years has increased since 2001, however,its values are below the average in RK: • The number of children in regular preschools has increased significantly since 2001: • The number of students in technical and vocational education is increasing, despite the decrease of the region’s population: • The number of students in higher educationisfalling:
Monthly average nominal salary per employee for 2011 is 67,252 Tenge, that is below the country’s average – 90,028 Tenge: • In the dynamics the average nominal salary per employee and the average nominal income per capita are ever-growing. • The index of the nominal and real incomes showed a decline during the economic crisisin 2008-2009. In 2009 the growth of nominal income was lower than the consumer price index, i.e. revenue growth did not cover inflation: Population Income
Despite theGRPgrowth, region’s share in total GRP of all the regions has fallen from 6.1% in 2000 to4.1% in 2011: • GRP growth in 2011 exceeds the average growth of total GRP of all the regions of Kazakhstanand makes up 132.5% compared to 2010, against the total value of RK - 126.4%: Economy
Fixed assets investment tends to a stable significant growth: • The growth of fixed assets investment in 2011 has greatly exceeded the total levelof RK regions and made up 124.7% compare to previous yearagainst 107.7% of the total in RK. This tendency can be explained by the base effect from the stronger investment decrease in 2010 in the region compared to the average in RK: • The share of fixed assets investment in the Kazakhstan’s level of investment has increased from 1.7% in 2000 to 3% in 2011: Investment
The volume of agriculture production was increasing till 2009, decreased in 2010 to 213.5 billion Tenge: • The share of the region’s volume of production in agriculture in total Kazakhstan’s volume of industry’s production. In 2010 14.8% of country’s agriculture production was manufactured in the region: Agriculture
The rowthof industrial production volumes was observed throughout the study period, excluding crisis year 2009, when the mining industry showed the decrease: • Real sector industries with the highest values of production in 2010 are metallic ores mining, agriculture,production of food products, construction, production and distribution of electricity, machine industry and etc.These industries have the significant share in the total production volume of RK andregion’s GRP: • The share of industrial production in the Kazakhstan’s level has increasedfrom 3.3% in 2000 to 3.5% in 2011: Real Sector
Sector Enterprises • The number of industrial enterpriseshas decreased dramatically since 2000, however, its share in RK level has grown compared to 2000: • The number of construction companies is increasing: • The number of working agricultural enterprises is falling:
Small and Medium Business • The number of registered legal entities as of October 1, 2012 is 12391. The SME number is 12263. The structure of the enterprises number is close to the RK average level: • SME share of the region's GRP is growing steadilyand is above the average in RK:
Budget revenues of Kostanay region in 2011 amounted to 118.0 trillion Tenge, including 80 trillion Tenge of transfers from the national budget. Expenses amounted to 117.6 trillion Tenge, including 1.4 trillion Tenge of transfers to the national budget. Thus, the region is subventional: Interbudgetary Relations
Main target indicators: • GRP increase in real terms in 2015 by 24.3% compared to 2009; • An increase of the share of industry in GRP in 2015 to 23% (2009 - 22.1%); • An increase of the share of the manufacturing industry in GRP in 2015 to 7% (2009 - 6.5%); • An increase of the share of non-resource exports in total exports to 15% (2009 - 13.2%); • An increase of the labor productivity in the manufacturing industry by 1.2 times; • Reduction of energy intensity of GRP by 2015 by 10% from the level in 2008; • An increase of the share of local content in the procurement of government agencies and organizations, strategic companies – for procurement of goods to 60%; • An increase of the proportion of local content in the procurement of government agencies and organizations, strategic enterprises - for procurement of works and services to 90%; • An increase of the iron ore production to 20.8 million tons (in 2009 - 18.5 million tons); • An increase of the production of metallurgical products by 1.3 times (2009 - 12,6 billion Tenge); • An increase of the labor productivity in the metallurgical industry by 1.5 times in 2015 (2009 - 100%); • An increase of the output of the machine industry to 20.0 billion Tenge (2009 - 13.9 million tons); • The labor productivity in the machine industry shall increase by 1.3 times (2009 - 9.5 million Tenge); • An increase of GVA of the construction industry to 6% in 2015 (2009 - 1.7%); • The labor productivity in agro industry shall increase by 1.8 times in 2015; • An increase of GVA of agro industry to 121.7%in 2015; • An increase of the share of SMEs in GRP to 19.9% in 2015 (2009 - 16%); • Reduction of operating costs of registering and doing business by 30% by 2011; • Coverage of preschool education and upbringing in educational institutions to 95% of children aged 1 to 6 years old in 2015. (2010 - 90.8%); • Life expectancy shall be 70 years in 2015 (2009 - 67.75); • Total mortality per 1000 people of the population - 11.0 in 2015 (2009 - 11.64); • The unemployment rate in 2015 - 5.5% (2009 - 6.3%); • The share of the population with income below the region’s minimum cost of living 2015 - 6.8%; • The level of pollutant discharge in 2015 - 3.5%; • The inflation rate in 2011-2015 to be in the range of 6-8%; • Growth rate of investment in fixed assets in real terms in 2015 shall be 18% compared to 2009. Kostanay Region Development Program for 2011-2015