Download
1 / 3
30 likes | 137 Views
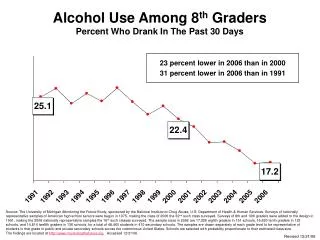
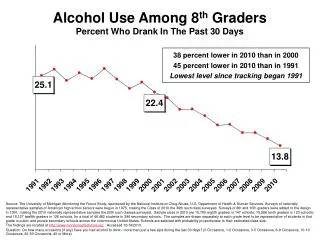
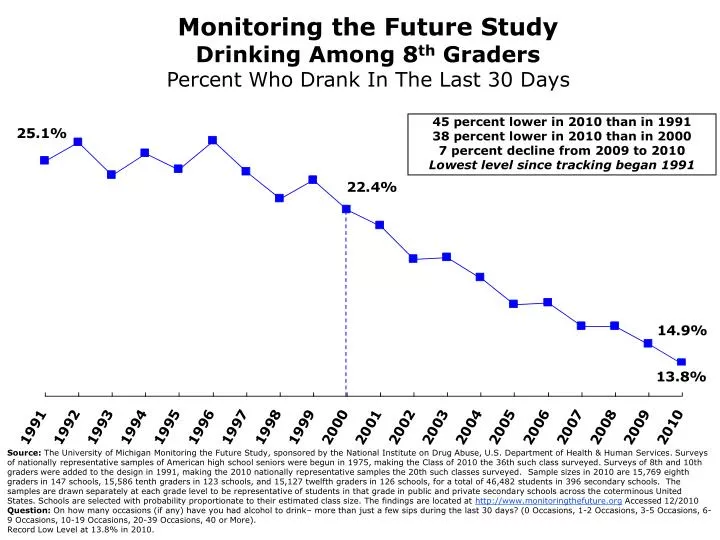
Monitoring the Future Study Drinking Among 8 th Graders Percent Who Drank In The Last 30 Days. 45 percent lower in 2010 than in 1991 38 percent lower in 2010 than in 2000 7 percent decline from 2009 to 2010 Lowest level since tracking began 1991.

E N D
Monitoring the Future Study Drinking Among 8th Graders Percent Who Drank In The Last 30 Days 45 percent lower in 2010 than in 1991 38 percent lower in 2010 than in 2000 7 percent decline from 2009 to 2010 Lowest level since tracking began 1991 Source: The University of Michigan Monitoring the Future Study, sponsored by the National Institute on Drug Abuse, U.S. Department of Health & Human Services. Surveys of nationally representative samples of American high school seniors were begun in 1975, making the Class of 2010 the 36th such class surveyed. Surveys of 8th and 10th graders were added to the design in 1991, making the 2010 nationally representative samples the 20th such classes surveyed. Sample sizes in 2010 are 15,769 eighth graders in 147 schools, 15,586 tenth graders in 123 schools, and 15,127 twelfth graders in 126 schools, for a total of 46,482 students in 396 secondary schools. The samples are drawn separately at each grade level to be representative of students in that grade in public and private secondary schools across the coterminous United States. Schools are selected with probability proportionate to their estimated class size. The findings are located at http://www.monitoringthefuture.org Accessed 12/2010 Question: On how many occasions (if any) have you had alcohol to drink– more than just a few sips during the last 30 days? (0 Occasions, 1-2 Occasions, 3-5 Occasions, 6-9 Occasions, 10-19 Occasions, 20-39 Occasions, 40 or More). Record Low Level at 13.8% in 2010.
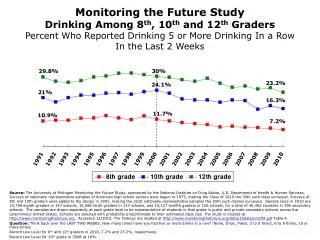
Monitoring the Future Study Drinking Among 10th Graders Percent Who Drank In The Last 30 Days 32 percent lower in 2010 than in 1991 30 percent lower in 2010 than in 2000 5 percent decline from 2009 to 2010 Lowest level since tracking began 1991 Source: The University of Michigan Monitoring the Future Study, sponsored by the National Institute on Drug Abuse, U.S. Department of Health & Human Services. Surveys of nationally representative samples of American high school seniors were begun in 1975, making the Class of 2010 the 36th such class surveyed. Surveys of 8th and 10th graders were added to the design in 1991, making the 2010 nationally representative samples the 20th such classes surveyed. Sample sizes in 2010 are 15,769 eighth graders in 147 schools, 15,586 tenth graders in 123 schools, and 15,127 twelfth graders in 126 schools, for a total of 46,482 students in 396 secondary schools. The samples are drawn separately at each grade level to be representative of students in that grade in public and private secondary schools across the coterminous United States. Schools are selected with probability proportionate to their estimated class size. The findings are located at http://www.monitoringthefuture.org Accessed 12/2010 Note– MTF report noted that the 2008–2009 observed changes based on the total samples to be inaccurate for this variable for 10th grade--the change derived from the matched half-sample of schools participating in both years has been substituted here. The 2008 data point has been removed from the 10th grade trend line.Question: On how many occasions (if any) have you had alcohol to drink– more than just a few sips during the last 30 days? (0 Occasions, 1-2 Occasions, 3-5 Occasions, 6-9 Occasions, 10-19 Occasions, 20-39 Occasions, 40 or More) Record Low Level at 28.9% in 2010.
Monitoring the Future Study Drinking Among 12th Graders Percent Who Drank In The Last 30 Days 40 percent lower in 2010 than in 1975 18 percent lower in 2010 than in 2000 5 percent decline from 2009 to 2010 Lowest level since tracking began 1975 Source: The University of Michigan Monitoring the Future Study, sponsored by the National Institute on Drug Abuse, U.S. Department of Health & Human Services. Surveys of nationally representative samples of American high school seniors were begun in 1975, making the Class of 2010 the 36th such class surveyed. Surveys of 8th and 10th graders were added to the design in 1991, making the 2010 nationally representative samples the 20th such classes surveyed. Sample sizes in 2010 are 15,769 eighth graders in 147 schools, 15,586 tenth graders in 123 schools, and 15,127 twelfth graders in 126 schools, for a total of 46,482 students in 396 secondary schools. The samples are drawn separately at each grade level to be representative of students in that grade in public and private secondary schools across the coterminous United States. Schools are selected with probability proportionate to their estimated class size. The findings are located at http://www.monitoringthefuture.org Accessed 12/2010Question: On how many occasions (if any) have you had alcohol to drink– more than just a few sips during the last 30 days? (0 Occasions, 1-2 Occasions, 3-5 Occasions, 6-9 Occasions, 10-19 Occasions, 20-39 Occasions, 40 or More) Record Low Level at 41.2% in 2010.