Download
1 / 32
340 likes | 618 Views
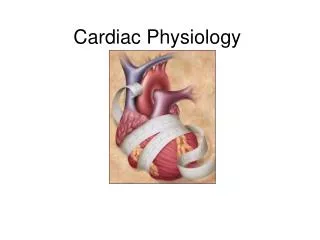
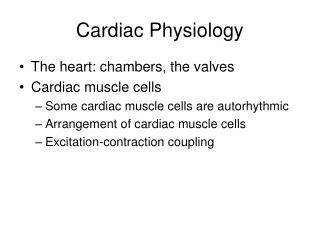
Cardiac Physiology II. PHIS 206 Roland Pittman September 24, 2014 Reading: Chap 9, pp 240-253. Electrocardiogram (ECG). Record of overall spread of electrical activity through heart Represents

E N D
Cardiac Physiology II PHIS 206 Roland Pittman September 24, 2014 Reading: Chap 9, pp 240-253
Electrocardiogram (ECG) • Record of overall spread of electrical activity through heart • Represents • Recording part of electrical activity induced in body fluids by cardiac impulse that reaches body surface • Not direct recording of actual electrical activity of heart • Recording of overall spread of activity throughout heart during depolarization and repolarization • Not a recording of a single action potential in a single cell at a single point in time • Comparisons in voltage detected by electrodes at two different points on body surface, not the actual potential • Doesn’t record potential at all when ventricular muscle is either completely depolarized or completely repolarized
Lead I: Right arm to left arm aVR: right arm aVL: left arm Lead II: Right arm to left leg Lead III: Left arm to left leg aVF: left leg Ground electrode (a) Limb leads (b) Chest leads Fig. 9-12, p. 241
SA node fires P wave = Atrial depolarization TP interval = Time during which ventricles are relaxing and filling R 200 msec PR segment = AV nodal delay T P P Recorded potential Q S ST segment TP interval PR segment T wave = Ventricular repolarization QRS complex = Ventricular depolarization atria repolarizing simultaneously) ST segment = Time during which ventricles are contracting and emptying Fig. 9-13, p. 242
NORMAL RATE AND RHYTHM ABNORMALITIES IN RATE Tachycardia ABNORMALITIES IN RHYTHM Extrasystole (premature ventricular contraction) Ventricular fibrillation Complete heart block CARDIAC MYOPATHIES Myocardial infarction (heart attack) Fig. 9-14, p. 243
Abnormalities in Rate • Tachycardia • Rapid heart rate of more than 100 beats per minute • Bradycardia • Slow heart rate of fewer than 60 beats per minute
Abnormalities in Rhythm • Rhythm • Regularity or spacing of ECG waves • Arrhythmia • Variation from normal rhythm and sequence of excitation of the heart • Examples • Atrial flutter • Atrial fibrillation • Ventricular fibrillation • Heart block
Cardiac Myopathies • Damage of the heart muscle • Myocardial ischemia • Inadequate delivery of oxygenated blood to heart tissue • Necrosis • Death of heart muscle cells • Acute myocardial infarction (heart attack) • Occurs when blood vessel supplying area of heart becomes blocked or ruptured
Ventrocilar systole Ventrocilar diastole 8 QRS 16 3 T 25 P Electrocardiogram Ejection phase 13 18 17 Aortic pressure (mm Hg) 12 Isovolumetric ventricular contraction 19 Left ventricular pressure (mm Hg) 10 Isovolumetric ventricular relaxation 9 4 Left atrial pressure (mm Hg) 1 22 5 21 End- diastolic volume 7 10 Ventricular filling phase 14 2 Left ventricular volume (ml) 6 Reduced filling 24 End systolic volume 23 20 Rapid filling 15 No sound Heart sounds Fig. 9-15A, p. 245
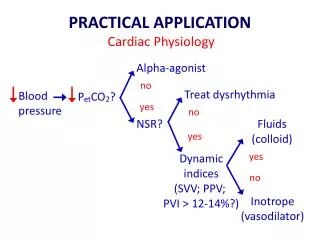
Cardiac Output • Volume of blood ejected by each ventricle each minute • Determined by heart rate times stroke volume
Cardiac Output • Heart rate is varied by altering balance of parasympathetic and sympathetic influence on SA node • Parasympathetic stimulation slows heart rate • Sympathetic stimulation speeds it up
Cardiac Output • Stroke volume • Determined by extent of venous return and by sympathetic activity • Influenced by two types of controls • Intrinsic control • Extrinsic control • Both factors increase stroke volume by increasing strength of heart contraction
KEY = Inherent SA node pacemaker activity = SA node pacemaker activity on parasympathetic stimulation = SA node pacemaker activity on sympathetic stimulation 0 Threshold potential Membrane potential (mV) –40 –60 Time (msec) 0 Threshold potential Membrane potential (mV) –40 –60 Time (msec) (a) Autonomic influence on SA node potential Fig. 9-17a, p. 248
Heart rate Sympathetic activity (and epinephrine) Parasympathetic activity (b) Control of heart rate by autonomic nervous system Fig. 9-17b, p. 248
Stroke volume Strength of cardiac contraction Extrinsic control Intrinsic control Sympathetic activity (and epinephrine) End-diastolic volume Intrinsic control Venous return Fig. 9-18, p. 249
Optimal length (lo) 200 (Cardiac muscle does not normally operate within the descending limb of the length– tension curve.) Stroke volume (SV) (ml) (related to muscle tension) 100 Increase in SV B1 A1 100 A B 200 300 400 500 Increase in EDV Normal resting length End-diastolic volume (EDV) (ml) (related to cardiac muscle fiber length) Fig. 9-19, p. 250
Frank-Starling Law of the Heart • States that heart normally pumps out during systole the volume of blood returned to it during diastole • Describes the relationship between the EDV (end diastolic volume) and stoke volume.
Cardiac output Heart rate Stroke volume Extrinsic control Intrinsic control Sympathetic activity (and epinephrine) End-diastolic volume Parasympathetic activity Intrinsic control Venous return Fig. 9-22, p. 251
Normal heart Normal stroke volume Stroke volume Failing heart Decrease in stroke volume Stroke volume with uncompensated heart failure Normal end-diastolic volume End-diastolic volume (a) Reduced contractility in a failing heart Fig. 9-23a, p. 252
Normal heart Failing heart with sympathetic stimulation Stroke volume Failing heart without sympathetic stimulation Normal stroke volume Normal end-diastolic volume Increase in end-diastolic volume End-diastolic volume (b) Compensation for heart failure Fig. 9-23b, p. 252
Nourishing the Heart Muscle • Muscle is supplied with oxygen and nutrients by blood delivered to it by coronary circulation, not from blood within heart chambers • Heart receives most of its own blood supply that occurs during diastole • During systole, coronary vessels are compressed by contracting heart muscle • Coronary blood flow normally varies to keep pace with cardiac oxygen needs
Area of cardiac muscle deprived of blood supply if coronary vessel is blocked at point A: Area of cardiac muscle deprived of blood supply if coronary vessel is blocked at point B: A Right coronary artery Left coronary artery Left ventricle B Right ventricle Fig. 9-26, p. 255
Coronary Artery Disease (CAD) • Pathological changes within coronary artery walls that diminish blood flow through the vessels • Leading cause of death in United States • Can cause myocardial ischemia and possibly lead to acute myocardial infarction • Three mechanisms • Profound vascular spasm of coronary arteries • Formation of atherosclerotic plaques • Thromboembolism
Vascular Spasm • An abnormal spastic constriction, coronary vessels narrow • Associated with early stages of CAD • Often triggered by cold, physical exertion, or anxiety • Reversible; not long lasting enough to damage heart
Atherosclerosis • Progressive, degenerative arterial disease • Gradual blockage of vessels, reducing flow • Plaques form beneath vessel lining with wall • Consist of lipid-rich core covered by an abnormal overgrowth of smooth muscle cells, topped with collagen-rich connective tissue cap • As plaque forms, it bulges into the vessel lumen • Contributing factors unclear
Collagen-rich smooth muscle cap of plaque Normal blood vessel wall Plaque Lipid-rich core of plaque Endothelium Lumen Plaque Fig. 9-24, p. 253
Atherosclerosis • Attacks arteries throughout body, but most serious damages happen to heart and brain (e.g. stroke, heart attack) • Complications of coronary atherosclerosis: • Angina pectoria • Thromboembolism • Heart attack