Download
1 / 21
220 likes | 352 Views
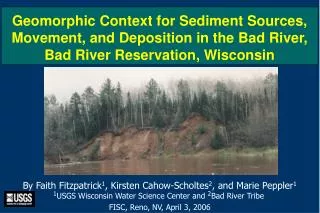
Geomorphic Context for Sediment Sources, Movement, and Deposition in the Bad River, Bad River Reservation, Wisconsin. By Faith Fitzpatrick 1 , Kirsten Cahow-Scholtes 2 , and Marie Peppler 1 1 USGS Wisconsin Water Science Center and 2 Bad River Tribe FISC, Reno, NV, April 3, 2006. Peat.

E N D
Geomorphic Context for Sediment Sources, Movement, and Deposition in the Bad River, Bad River Reservation, Wisconsin By Faith Fitzpatrick1, Kirsten Cahow-Scholtes2, and Marie Peppler11USGS Wisconsin Water Science Center and 2Bad River Tribe FISC, Reno, NV, April 3, 2006
Peat Sand/gravel Other Clay Loam Ontario Minnesota Lake Superior Apostle Islands Michigan Wisconsin Bad River Indian Reservation Bad River watershed
Problem • The Bad River is the largest sediment source to Lake Superior from the U.S. • Deposition at the mouth has unknown effects on riverine and estuary habitat • Are high sedimentation rates natural? Wisconsin State Historical Society
Geomorphic approach for assessing erosion/sedimentation Field--Reach Reach-level geomorphic assessments Valley and channel cross section surveys and coring Helicopter surveys Photo points GIS--Watershed Watershed thematic maps—land cover, soils, geology, elevation, dams Historical Data Streamflow records and rating curves Air photo interpretation General Land Office Surveys 1928 WI Land Economic Inventory Bridge designs Channel alterations Longitudinal Profiles Stream network position Multiple lines of evidence Laboratory Sediment texture and organic content Radiometric dating Trace elements Clay mineralogy Modeling Rainfall/runoff Sediment transport
Valley Cross Section Surveys and Coring 1860 channel location Core Transect line Section line photo by M. Peppler
Land Cover Potato River White River Marengo River Bad River Tyler Forks
Northern Great Lakes Cutover —Late 1800s Photos courtesy Wisconsin State Historical Society
Surficial deposits Bad River Reservation Potato River Penokee Iron Range Marengo River Tyler Forks White River Bad River
Longitudinal Profiles Sandy glacial till, Poorly developed drainage network, no valley Bad River Marengo River Bedrock outcrop Sandy post-glacial shorelines, entrenched valley x Clay plain, entrenched/alluvial valley
Bad River – Annual Peak Flow May 2003 June 1946 April 1960 July 1992 May 2003
Bad River—upstream of the Penokee Range Penokee Iron Range
1930s 1950s Copper Falls, Bad River 2003
Ontonagon River, MI Cranberry River, WI Landslides Episodic Failure, Long-Term Consequences Bad River Flow direction 1975 Landslide Flow direction
Marengo River—Cross Sections 60-m eroding bluff glacial deposits sand gravel/cobble/boulder Natural levee Pre-settlement soil buried channel
Marengo River—Levee building, May 2003 flood 1992
Bad River at USGS streamflow gaging station
Bad River at gaging station 1946 Stage for 10 largest annual peak flows 1960 Core 2 2003 1992 1949 1954, 2002 1996, 2001 m. sand 1916 BC 110-AD 70 loam clay buried soil AD 1410-1470 m./c. sand gravel diamicton
Bad River – near mouth Meters 0 Post-European settlement sandy alluvium 1.8 Large woody debris Peat 2.7 Low-flow water level
Preliminary Conclusions • Rates of erosion, transport, and deposition of sediment in the Bad River watershed are elevated above pre-settlement rates. Causes: current and historical land-use practices and more frequent large floods • The main source of sediment is landslides/bluff erosion along main stems and tributaries with entrenched valleys that flow through sandy shoreline deposits related to early Holocene levels of Lake Superior • Erosion, transport, and deposition is dependent on watershed and local geologic setting and position within the drainage network • Post-settlement levee building has been accelerated, resulting in entrenched-looking channels and loss of flood-plain storage
Acknowledgments • Funding from USGS cooperative study with: • Bad River Band of the Lake Superior Chippewa Tribe • Technical Assistance: • Leah Gibala (Bad River) • Ed Kolodjeski (Bad River) • Tracy Ledder (Bad River) • Jamie Eckholm (Bad River) • Dawn Trexel (Bad River) • Tom Popowski (USGS) • Krista Stensvold (USGS)