Download

1 / 25
250 likes | 440 Views
Effects of Climate Change on Marine Ecosystems David Mountain US CLIVAR Science Symposium 14 July 2008. US GLOBEC Program Effect of Climate Change on Marine Ecosystems. Process oriented Physics-Plankton-Fish Regional Programs. Given climate predictions, predict ecosystem response.

E N D
Effects of Climate Change on Marine Ecosystems David Mountain US CLIVAR Science Symposium 14 July 2008
US GLOBEC Program Effect of Climate Change on Marine Ecosystems Process oriented Physics-Plankton-Fish Regional Programs Given climate predictions, predict ecosystem response Application to fishery management
Outline: - Effects of climate change on Ecosystems - Climate parameters desired by Ecosystems - Ecosystem-CLIVAR collaborations
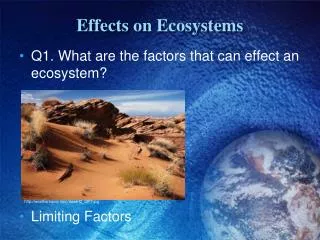
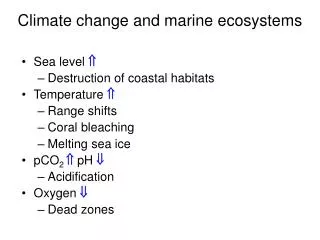
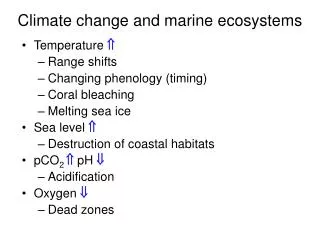
Effects of Climate Change on Marine Ecosystems General: Warming - shifting species distributions - corals – bleaching ENSO frequency, strength Low dissolved Oxygen (‘dead zones’) Loss of sea ice Ocean acidification
Northwest Atlantic – Gulf of Maine/Georges Bank Two major inflows: Scotian Shelf Water (blue arrow) (cold, fresh) Slope water (red arrow) (warm, saline) Change in SSW inflow
NW Georges Bank Salinity Anomaly (0-30m) Decrease in salinity during the 1990’s Increased Scotian Shelf inflow
Ecosystem Response to Salinity Changes Georges Bank salinity anomaly Haddock 1st Year Survival vs Zoo-X R / Egg Hatched Zooplankton community structure (Kane, 2007) Zoo X-Coordinate
Salinity Anomaly & Labrador Current Transport Origin of Low Salinity? O18 indicates high latitude source Labrador current transport (one year lag) Gulf Stream movement Rossby’s north wall of the Gulf Stream All part of large-scale response of the ocean to climate forcing
Northeast Pacific Regime Shifts 1976-1977 Major changes in many physical and biological parameters PDO (Pacific Decadal Oscillation – 1st mode of SSTa) (Peterson and Schwing, 2003)
Actually 2 modes of variability: - PDO - North Pacific Gyre Oscillation (NPGO) PDO NPGO 1st mode of SSTa 2nd mode of SSHa PDO – single gyre + Alaska gyre - California Current NPGO – two gyres + Alaska Coastal Current + California Current (Di Lorenzo et al, 2008)
Di Lorenzo et al. (2008) – ROMS model of the N. Pacific Ocean, forced by NCEP winds and heat flux, with an NPZD for 1950-2004 Response in coastal system to large scale, regional forcing.
North (48 N) Upwelling Delayed Upwelling in 2005 Delay in seasonal production cycle Adverse affect on young salmon survival Closure of salmon fishing in 2008 Seasonal timing is important ! South (33 N) (Schwing et al., 2006)
Important points: Continental shelves are important (..very important…) Climate changes elsewhere can be advected into the region Stratification and vertical processes important Timing within a season can be important
Decadal Climate Predictions What ‘Marine Ecosystems’ would want to know: The ‘usual suspects’ – Winds Ocean temperature Ocean circulation Precipitation (and river discharge) The ‘not-so-usual suspects’ Major atmospheric & oceanic indices (ENSO, PDO, NPGO, NAO, AO, ….)
and … The “…hard, but critical…” needs – Resolve continental shelves (horizontal) (coastal-scale oceanic and met conditions) Resolve ocean surface layer (vertical) (upwelling, stratification, convection….)
Other considerations: “When you’re dead …. you’re dead.” Variability often more important than the mean (e.g., salmon & delayed upwelling) Range, probability distribution for critical parameters Important for application to decision processes
Ecosystem – CLIVAR Collaborations Topics areas: Spatial resolution for shelves – nesting fine scale models horizontal and vertical resolution Including biology coupled bio-physical models
Regions: Northeast Pacific – Gulf of Alaska & N California Current (following Di Lorenzo et al. 2008) North Atlantic – Basin-scale changes and fish ‘BASIN’
BASIN: Basin-scale Analysis, Synthesis, and Integration. Resolving the impact of climatic processes on ecosystems of the North Atlantic basin and shelf seas. BASIN is an initiative to develop a joint EU/North American ocean ecosystem research program. (Courtesy of Peter Wiebe, WHOI)
Concerning application of results: The science is: Transition to application is: this hard this hard - Involve a ‘manager’ from the beginning - Keep expectations modest
Low Dissolved Oxygen ‘Dead zones’ – many areas around the world Land derived nutrients + increased stratification Off Oregon – deeper upwelling (lower O2 + nutrients) stratification residence time on shelf (?) Pre-2000 + 2000-2005 (green) + 2006 (red) (Chan et al., 2008)
Probability … could be important for management applications Haddock Survival R / Egg Hatched Zoo X - Coordinate Probability of bad years ahead? Protect the stock
Increase in Oceanic Low Productivity Areas Surface chl-a < 0.07 mg/m3 Increasing area Increasing SST Likely increasing stratification (Polovina et al., in press)