Fourier Transform in Image Processing
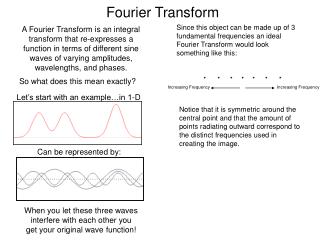
Fourier Transform in Image Processing. Review - Image as a Function. We can think of an image as a function, f , f: R 2 R f ( x, y ) gives the intensity at position ( x, y ) Realistically, we expect the image only to be defined over a rectangle, with a finite range:


Fourier Transform in Image Processing
E N D
Presentation Transcript
Review - Image as a Function • We can think of an image as a function, f, • f:R2R • f (x, y)gives the intensity at position (x, y) • Realistically, we expect the image only to be defined over a rectangle, with a finite range: • f: [a,b]x[c,d] [0,1] • A color image is just three functions pasted together. • We can write this as a “vector-valued” function:
Image as a Function • function, f, • f:R2R • f (x, y)gives the intensity at position (x, y)
Transformations on Images • Define a new image gin terms of an existing image f • We can transform: • either the domain • or the range of f • Range transformation: • What kinds of operations on the image can this transformation perform? • What t transformations are good for what?
Operations that change the domain of image • Some operations preserve the range but change the domain of f • Here is an example that changes the domain: • What kinds of operations can this perform? • Still other operations operate on both the domain and the range of f . In general we are interested in all these transformations Specifically we want them to have some nice (like linear) properties
Linear Shift Invariant Systems (LSIS) Linearity: Shift invariance:
LSIS Example of LSIS: ideal lens Linear Shift Invariant Systems (LSIS) Defocused image ( g ) is a processed version of the focused image ( f ) Ideal lens is a LSIS Linearity: Brightness variation Shift invariance: Scene movement (this is not valid for lenses with non-linear distortions)
LSIS is Doing a Convolution Linear Shift Invariant Systems (LSIS) convolutionis linear and shift invariant Continuous convolution defined by integral Discrete convolution from previous lectures defined by finite sums We negate (mirror) the kernel of convolution h kernel h
Convolution – two more Examples Here we show two more examples of convolution of functions f and g We use two non-idea approximation of Dirac’s Delta function as a signal model From Eric Weinstein’s Math World
Convolution – Another Example 1 1 -1 1 -1 1 Here we convolve signals a and b into convolved signal c 1 -2 -1 1 2
Convolution Kernel – Impulse Response • We ask question “What h will give us g = f ?” Dirac Delta Function (Unit Impulse) Sifting property: We convolve f with Dirac Delta: And we get this Therefore g=f when we convolve with delta
Optical System point source point spread function • However, optical systems are never ideal. • Point spread function of Human Eyes Point Spread Function Now we apply information from last slide to optical system Optical System scene image • Ideally, the optical system should be a Dirac delta function. (no distortion) PSF stands for Point Spread Function If the PSF of human eye is different (not a good approximation of delta) then we have eye troubles, related to this PSF type
Point Spread Function PSF stands for Point Spread Function normal vision myopia hyperopia Tell me what your PSF is and I will tell you what is your eye problem. astigmatism Images by Richmond Eye Associates
Cascade system Properties of Convolution Convolution operator • Commutative • Associative This is unlike matrix multiplication and Kronecker (tensor) products We used in cascading filters in previous lectures. Now we have a theoretical base These are general properties of convolution , not related to signal representation
So now we know what is convolution and why it is so important. • However signals for convolution can be represented in various ways. • So the question is, “how to represent signals?” • 1D • 2D • 3D?
How to Represent Signals? • Option 1: Taylor series represents any function using polynomials. • Polynomials are not the best - unstable and not very physically meaningful. (they still have some applications) • Easier to talk about “signals” in terms of its “frequencies” (how fast/often signals change, etc).
Jean Baptiste Joseph Fourier (1768-1830) • Had crazy idea (1807): • Any periodic function can be rewritten as a weighted sum of Sines and Cosines of different frequencies. • Don’t believe it? • Neither did Lagrange, Laplace, Poisson and other big wigs • Not translated into English until 1878! • But it’s true! • called Fourier Series • Possibly the greatest tool used in Engineering
A Sum of Sinusoids • Our building block: • Add enough of them to get any signal f(x) you want! • How many degrees of freedom? • What does each control? • Which one encodes the coarse vs. fine structure of the signal?
Math Review - Complex numbers • Real numbers: 1 -5.2 • Complex numbers 4.2 + 3.7i 9.4447 – 6.7i -5.2 (-5.2 + 0i) We often denote in EE i by j
Complex numbers 4.2 + 3.7i 9.4447 – 6.7i -5.2 (-5.2 + 0i) General Form Z = a + bi Re(Z) = a Im(Z) = b Amplitude A = | Z | = √(a2 + b2) Phase = Z = tan-1(b/a) Math Review - Complex numbers Real and imaginary parts
b a Math Review – Complex Numbers • Polar Coordinate Z = a + bi • Amplitude A = √(a2 + b2) • Phase = tan-1(b/a) A
Math Review – Complex Numbers and Cosine Waves • Cosine wave has three properties • Frequency • Amplitude • Phase • Complex number has two properties • Amplitude • Wave • Complex numbers to represent cosine waves at varying frequency • Frequency 1: Z1 = 5 +2i • Frequency 2: Z2 = -3 + 4i • Frequency 3: Z3 = 1.3 – 1.6i Simple but great idea !!
Inverse Fourier Transform Fourier Transform F(w) f(x) F(w) f(x) Fourier Transform Idea • We want to understand the frequency w of our signal. So, let’s reparameterizethe signal by w instead of x: • For every wfrom 0 to infinity, F(w) holds the amplitude A and phase f of the corresponding sine • How can F hold both? Complex number trick! All info preserved
Math Review - Periodic Functions – more illustrations to our formalism
Math Review - Periodic Functions If there is some a, for a function f(x), such that f(x) = f(x + na) then function is periodicwith the period a a 2a 3a 0
Amplitude Phase f(x) = cos (x) f(x) = 5 cos (x) f(x) = 5 cos (x + 3.14) Math Review - Attributes of cosine wave
Amplitude Phase Frequency f(x) = 5 cos (x) f(x) = 5 cos (x + 3.14) f(x) = 5 cos (3 x + 3.14) Math Review - Attributes of cosine wave
f(x) = cos (x) Amplitude, Frequency, Phase Math Review - Attributes of cosine wave • f(x) = A cos (kx + ) This math is base of Fourier Analysis and Fourier Synthesis
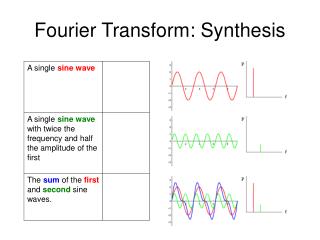
Time and Frequency • example : g(t) = sin(2 f t) + (1/3)sin(2(3f) t) Our periodic signal is a mixture of two frequencies Before we go to using complex numbers and formulas let us get intuition about time and frequency
Time and Frequency • example : g(t) = sin(2 f t) + (1/3)sin(2(3f) t) = +
Frequency Spectra • example : g(t) = sin(2pf t) + (1/3)sin(2p(3f) t) = + In time domain In frequency domain
Frequency Spectra • Usually, frequency is more interesting than the phase We will decompose it to frequencies, we will add one more coefficient based base function in each slide
Frequency Spectra First base function second base function = + = Sum of first and second base functions is already not bad approximation
Frequency Spectra = + = Sum of first , second and third base functions is even better approximation
Frequency Spectra = + =
Frequency Spectra = + =
Frequency Spectra = + =
Frequency Spectra = In time domain In frequency domain
Frequency Spectra Observe the negative values of domain that appear in spectrum
Fourier Transform is Just a change of basis Important concept
Fourier Transform is Just a change of basis M can be a matrix, a decision diagram, a butterfly, a system (physical or simulated) M * f(x) = F(w) = * . . .
IFT: Just a change of basis Inverse Fourier Transform is similarly only a change of basis M-1 * F(w)= f(x) = * . . .
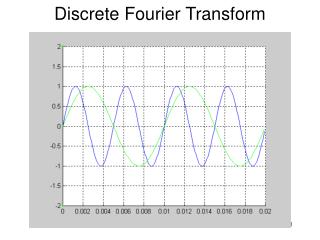
Image Fourier Transform Fourier Transform is an invertible operator FT v2 will display image or its transform, Matlab examples.
Image Fourier Transform Ny ⁄ 2 Ny y Nx ⁄ 2 0 Nx x {f(x,y)} = F(kx,ky) {F(kx,ky)} = f(x,y)} Fourier Transform is an invertible operator f(x,y) F(kx,ky) Similarly as for Hadamard-Walsh or Reed-Muller Transforms we can talk about transform pairs.
f(x) = F(s) Euler’s Formula Continuous Fourier Transform Various normalizations of pairs
Image Domain Forward Transform f(x,y,z) g(x) F Fourier Domain Reciprocal space Fourier Space K-space Frequency Space Spectral domain ReverseTransform, Inverse Transform F(kx,ky,kz) G(s) F Some Conventions for Fourier Transforms