Download
1 / 2
20 likes | 240 Views
Sistema Nacional para el Desarrollo Rural Sustentable SNIDRUS. Valor de las Exportaciones Agrícolas 2005-2009. Sistema Nacional para el Desarrollo Rural Sustentable SNIDRUS. . Oficina Estatal de Información para el Desarrollo Sustentable en el Estado de Sonora. OEIDRUS.

E N D
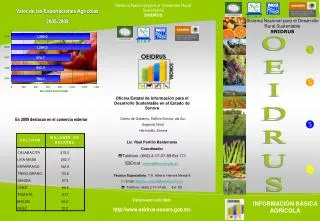
Sistema Nacional para el Desarrollo Rural Sustentable SNIDRUS Valor de las Exportaciones Agrícolas 2005-2009 Sistema Nacional para el Desarrollo Rural Sustentable SNIDRUS Oficina Estatal de Información para el Desarrollo Sustentable en el Estado de Sonora OEIDRUS En 2009 destacan en el comercio exterior Centro de Gobierno, Edificio Sonora, ala Sur, Segundo Nivel. Hermosillo, Sonora • Lic. Raúl Portillo Balderrama • Coordinador • Teléfono: (662) 2-17-07-89 Ext 171 • Email: oeidrus@sonora.gob.mx • Técnico Especialista: T.A. Alberto Herrera Mendivil • Email: alberto_oeidrus@yahoo.com.mx Teléfono: (662) 2-17-07-89 Ext 151 • Visita nuestro sitio Web: • http://www.oeidrus-sonora.gob.mx INFORMACIÓN BÁSICA AGRÍCOLA
AGRICULTURA Durante el periodo 2006 – 2009 la producción agrícola creció en promedio anual en un 7.55 %. Cultivos como: trigo grano, cártamo, garbanzo, hortalizas, uva, nogal, espárrago y forrajes, son los productos mas dinámicos en la producción agrícola. En los mismos años, el valor de la producción agrícola pasó de 11,191.0 a 20,846.2 millones de pesos. En el año 2009 las exportaciones agrícolas fueron de 1,289 millones de dólares, destacando las hortalizas, frutales, calabacita, espárrago y cereales. SUPERFICIE SEMBRADA POR GRUPOS DE PRODUCTOS (MILES DE HECTAREAS) TENDENCIA DEL VALOR DE LA PRODUCCION AGRICOLA 2005 – 2009 (MILLONES DE PESOS) P/ = PRELIMINAR PRODUCCION OBTENIDAS POR GRUPOS DE PRODUCTOS (MILES DE TONELADAS) PARTICIPACION PORCENTUAL DE LA SUPERFICIE SEMBRADA Y EN EL VALOR DE LA PRODUCCION AGRICOLA 2009 Las hortalizas, frutales y cereales son los cultivos con las tendencias de crecimiento màs estables y significativos. PARTICIPACION Y POSICION DE SONORA EN LA PRODUCCION NACIONAL AGRICOLA P/ = PRELIMINAR VALOR DE LA PRODUCCION POR GRUPOS DE PRODUCTOS (MILLONES DE PESOS) • Las frutas y hortalizas ocupan el 15.0% de la superficie sembrada, empero en el valor representan el 57.0% • En cambio los cereales ocupan el 59.0 % de la superficie sembrada, en el valor contribuyen con 32.5%. P/ = PRELIMINAR FUENTE: Todos los cuadros del tríptico fueron elaborados por la OEIDRUS con información de los Distritos de Desarrollo Rural, SAGARPA, SIAP y del INEGI.