Download
1 / 13
130 likes | 296 Views
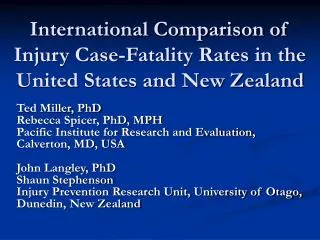
International Comparison of Injury Case-Fatality Rates in the United States and New Zealand. Ted Miller, PhD Rebecca Spicer, PhD, MPH Pacific Institute for Research and Evaluation, Calverton, MD, USA John Langley, PhD Shaun Stephenson

E N D
International Comparison of Injury Case-Fatality Rates in the United States and New Zealand Ted Miller, PhD Rebecca Spicer, PhD, MPH Pacific Institute for Research and Evaluation, Calverton, MD, USA John Langley, PhD Shaun Stephenson Injury Prevention Research Unit, University of Otago, Dunedin, New Zealand
Objectives • To compare injury case-fatality rates between the United States and New Zealand • Use the observed differences to generate new research questions
Methods • Data • New Zealand E-coded hospital discharge and mortality census data (1992-1996) • United States National Hospital Discharge Survey (1996) • 63% of cases E-coded • E-codes for the remainder of cases modeled based on diagnosis and age group. • United States mortality census data (1996) • Hospitalized case definition: AIS 3 to 6 only, first admission, not discharged dead
New Zealand 35,552 Cases United States 744,476 Cases
Conclusions • Case-fatality rates in NZ and the US differ dramatically depending on the cause of the injury. • Why?
Possible reasons for the observed differences • Data collection and coding procedures? • Motor vehicle injuries: • Road and vehicle standards? • Helicopter transport for the severely injured? • Firearm injuries: • Types of firearms? • Greater US experience treating gunshot victims? • Poisoning: • Poison treatment availability? • Types of poisons? • Mechanical injury: occupational differences? • Burn injury: Risk of house fires in the US? • Natural/environmental injury: Environment/animal differences
Limitations • Possible coding differences between countries • Small number of cases, particularly for New Zealand • Misclassification of cause