Download
1 / 33
370 likes | 675 Views
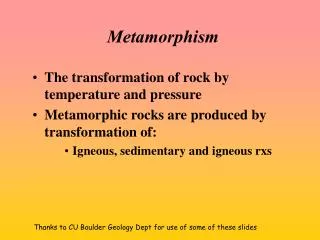
Chapter 30: Metamorphic Fluids and Metasomatism. “Wet-chems”: gravimetric/volumetric Modern Spectroscopic Techniques much faster capable of analyzing to very low concentrations still requires standards Still express as weight % oxides holdover to wet chems

E N D
Chapter 30: Metamorphic Fluids and Metasomatism “Wet-chems”: gravimetric/volumetric Modern Spectroscopic Techniques much faster capable of analyzing to very low concentrations still requires standards Still express as weight %oxides holdover to wet chems OK for most rocks (O the common anion) but I’d really prefer mole % oxides
Chapter 30: Metamorphic Fluids and Metasomatism Figure 30-1. Fluid speciation in the C-O-H-S system at 1100oC and 0.5 GPa projected from S to the C-O-H triangle (mole proportions). fS2 is determined by pyrrhotite with the composition Fe0.905S. After Holloway (1981) Compositions and volumes of supercritical fluids in the Earth's crust. In L. S. Hollister and M. L. Crawford (1981). Short Course in Fluid Inclusions: Applications to Petrology. Mineral. Assoc. Canada. Winter (2001) An Introduction to Igneous and Metamorphic Petrology. Prentice Hall.
Chapter 30: Metamorphic Fluids and Metasomatism Figure 30-1. Speciation in C-O-H-S fluids coexisting with graphite at 0.2 GPa with fO2 buffered by quartz-fayalite-magnetite and fS2 controlled as in Figure 30-1. is the mole fraction of each species in the fluid. From Holloway (1981) Compositions and volumes of supercritical fluids in the Earth's crust. In L. S. Hollister and M. L. Crawford (1981). Short Course in Fluid Inclusions: Applications to Petrology. Mineral. Assoc. Canada. Winter (2001) An Introduction to Igneous and Metamorphic Petrology. Prentice Hall.
Chapter 30: Metamorphic Fluids & Metasomatism Figure 30-3. Variation in the dissociation constant of NaCl in aqueous solutions with temperature and pressure. Shaded arrows indicate regional and contact metamorphic P-T paths. After Sverjensky (1987) In I. S. E. Carmichael and H. P. Eugster (eds.), Thermodynamic Modeling of Geological Materials: Minerals, Fluids, Melts. Rev. in Mineralogy, 17, Mineral. Soc. Amer, pp. 177-209. Winter (2001) An Introduction to Igneous and Metamorphic Petrology. Prentice Hall.
Chapter 30: Metamorphic Fluids & Metasomatism Figure 30-4. Speciation in aqueous-chloride fluids calculated for an ultramafic bulk composition assuming a geothermal gradient of 0.1oC/bar. mi is the molality of species i in the fluid. After Eugster and Baumgartner (1987) Mineral solubilities and speciation in supercritical metamorphic fluids. In I. S. E. Carmichael and H. P. Eugster (eds.), Thermodynamic modeling of geological materials: Minerals, fluids, melts. Rev. in Mineralogy, 17, Mineral. Soc. Amer, pp. 367-403. Winter (2001) An Introduction to Igneous and Metamorphic Petrology. Prentice Hall.
Chapter 30: Metamorphic Fluids & Metasomatism Figure 30-5. Three-dimensional distribution of fluid about a single grain at q < 60o (left) and q > 60o (right). In the center is a cross section through a fluid tube at the intersection of three mineral grains for which q = 60o. After Brenan (1991) Development and maintenance of metamorphic permeability: Implications for fluid transport. In D. M. Kerrick (ed.), Contact Metamorphism. Rev. in Mineralogy, 26, Mineral. Soc. Amer, pp. 291-320.
Chapter 30: Metamorphic Fluids & Metasomatism Figure 30-6. A hypothetical column of rock proposed by J. B. Thompson (1959) Local equilibrium in metasomatic processes. In P. H. Abelson (ed.), Researches in Geochemistry. v. 2. John Wiley. 427-457. pp. 427-457. The left end is pure periclase and the right end pure quartz. Between these ends the bulk composition varies continuously so that the wt. % SiO2 increases linearly from left to right (dashed line). Winter (2001) An Introduction to Igneous and Metamorphic Petrology. Prentice Hall.
Chapter 30: Metamorphic Fluids & Metasomatism Figure 30-7. A hypothetical column of rock proposed by J. B. Thompson (1959) Local equilibrium in metasomatic processes. In P. H. Abelson (ed.), Researches in Geochemistry. v. 2. John Wiley. 427-457. pp. 427-457. The left end is pure periclase and the right end pure quartz. Between these ends the bulk composition varies continuously so that the wt. % SiO2 increases linearly from left to right (dashed line). Winter (2001) An Introduction to Igneous and Metamorphic Petrology. Prentice Hall.
Chapter 30: Metamorphic Fluids & Metasomatism Figure 30-8. Schematic G-XSiO2 diagram for the SiO2-MgO system at fixed temperature and pressure. Winter (2001) An Introduction to Igneous and Metamorphic Petrology. Prentice Hall.
Chapter 30: Metamorphic Fluids & Metasomatism Figure 30-9. Expanded view of the monomineralic enstatite zone in Figure 30-7, showing the profiles of XSiO2 and mSiO2. Winter (2001) An Introduction to Igneous and Metamorphic Petrology. Prentice Hall.
Chapter 30: Metamorphic Fluids & Metasomatism Figure 30-7. The hypothetical column of rock of J. B. Thompson (1959) with the sequences of mineral assemblages expected to form if diffusion is effective and the amounts of periclase and quartz prove inexhaustible. The dashed line shows the variation in wt.% SiO2 across the column and the lighter dot-dashed lines show the variation in mSiO2 and mMgO. After J. B. Thompson (1959) Local equilibrium in metasomatic processes. In P. H. Abelson (ed.), Researches in Geochemistry. v. 2. John Wiley. 427-457. pp. 427-457. Winter (2001) An Introduction to Igneous and Metamorphic Petrology. Prentice Hall.
Chapter 30: Metamorphic Fluids & Metasomatism Figure 30-11.aSiO2 – aH2O diagram for fluids in the MgO-SiO2-H2O system at 600oC and 0.2 GPa calculated using the TQW program (Berman, 1988, 1990, 1991). Winter (2001) An Introduction to Igneous and Metamorphic Petrology. Prentice Hall.
Chapter 30: Metamorphic Fluids & Metasomatism Figure 30-12. SiO2-MgO chemographic diagram assuming only Qtz, Fo, En, and Per are stable. Winter (2001) An Introduction to Igneous and Metamorphic Petrology. Prentice Hall.
Chapter 30: Metamorphic Fluids & Metasomatism Figure 30-13. “Gresens-type” variation diagram showing the gains or losses (in grams per 100 grams of original rock A) as a function of the volume factor, fv, in eq. (30-13). Rock A is a garnet phyllite from Stavanger, Norway, and rock B is a metasomatized albite schist, supposedly derived from (A) After Gresens (1967) Chem. Geol., 2, 47-65. Winter (2001) An Introduction to Igneous and Metamorphic Petrology. Prentice Hall.
Chapter 30: Metamorphic Fluids & Metasomatism Figure 30-14. Isocon diagram of Grant (1986) for the data from Table 30-1. Some oxides have been scaled to provide a better distribution of data points. Econ. Geol., 81, 1976-1982. Winter (2001) An Introduction to Igneous and Metamorphic Petrology. Prentice Hall.
Chapter 30: Metamorphic Fluids & Metasomatism Figure 30-15. “Ideal” mineral zonation due to metasomatism in < 3-m long ultramafic pods in low-grade regionally metamorphosed pelites at Unst, Shetland Islands. After Read (1934) Mineral. Mag., 23, 519-540. Winter (2001) An Introduction to Igneous and Metamorphic Petrology. Prentice Hall.
Chapter 30: Metamorphic Fluids & Metasomatism Figure 30-16. Variation in mineral proportions across the zones between the ultramafic and quartzo-feldspathic gneiss contact at Grafton, Vermont, after Sanford (1982). Zone letters at the top correspond to the zones listed in the text. Zone letters at the top are: A = Tlc + Ath, B = Tlc, C = Act + Chl, D = transitional, E = quartzo-feldspathic country rock. The vertical dashed line represents the estimated initial contact. After Sanford (1982) Amer. J. Sci., 282, 543-616. Winter (2001) An Introduction to Igneous and Metamorphic Petrology. Prentice Hall.
Chapter 30: Metamorphic Fluids & Metasomatism Figure 30-17. AMS diagram (A = Al2O3, M = MgO + FeO, and S = SiO2), projected from K2O, for ideal lower-temperature metasomatic zones around ultramafic bodies. After Brady (1977) Geochim. Cosmochim. Acta, 41, 113-125. Winter (2001) An Introduction to Igneous and Metamorphic Petrology. Prentice Hall.
Chapter 30: Metamorphic Fluids & Metasomatism Figure 30-18. Hypothetical mM-mSiO2 diagram for fluids in the AMS system (Figure 30-16). Paths (1), (2), and (P&H) refer to the theoretical paths in Figure 30-16, and the observed sequence of Phillips and Hess (1936). After Brady (1977) Geochim. Cosmochim. Acta, 41, 113-125. Winter (2001) An Introduction to Igneous and Metamorphic Petrology. Prentice Hall.
Chapter 30: Metamorphic Fluids & Metasomatism Figure 30-19. The same portion of the AMS diagram as in Figure 30-16, projected from K2O and CaO, with the locations of analyzed rocks from the metasomatized zones of Read (1934, see Figure 30-14), reported by Curtis and Brown (1969). The dashed curve represents a path through the zonal sequence. After Brady (1977) Geochim. Cosmochim. Acta, 41, 113-125. Winter (2001) An Introduction to Igneous and Metamorphic Petrology. Prentice Hall.
Chapter 30: Metamorphic Fluids & Metasomatism Figure 30-20. Schematic representation of major silicate mineral reactions and component fluxes associated with metasomatism of the ultramafic body at Grafton, Vt. Elemental fluxes across various zones are indicated by the arrows at the top. Arrows between mineral boxes (somewhat distorted from the true modes in Figure 30-15) indicate reactions. When horizontal, these arrows involve metasomatic reactions; when vertical they are approximately isochemical. The zones listed at the bottom correspond to those in Figure 30-15, and the heavy dashed line is the estimated original contact. After Sanford (1982) Amer. J. Sci., 282, 543-616. Winter (2001) An Introduction to Igneous and Metamorphic Petrology. Prentice Hall.
Chapter 30: Metamorphic Fluids & Metasomatism Figure 30-21. Variation in chemical potentials of major components across the metasomatic zones at Grafton, Vt. Estimated temperature = 530oC. Typical data points and error bars are illustrated for the MgO profile. Lettered zones at the top correspond to those in Figure 30-15. The dashed vertical line is the estimated original contact. After Sanford (1982). Amer. J. Sci., 282, 543-616. Winter (2001) An Introduction to Igneous and Metamorphic Petrology. Prentice Hall.
Chapter 30: Metamorphic Fluids & Metasomatism Figure 30-22. The three principal types of skarns. From Kerrick (1977) J. Petrol., 18, 144-181. Winter (2001) An Introduction to Igneous and Metamorphic Petrology. Prentice Hall.
Chapter 30: Metamorphic Fluids & Metasomatism Figure 30-23. Chert nodule in carbonate with layer sequence: calcite | tilleyite | wollastonite | quartz. Christmas Mts., Texas. From Joesten and Fisher (1988) Geol. Soc. Amer. Bull., 100, 714-732.
Chapter 30: Metamorphic Fluids & Metasomatism Figure 30-24. Schematic isothermal isobaric mCO2-mH2O diagram for fluids in the CaO-SiO2-H2O system at high temperatures. After Joesten (1974) Amer. J. Sci., 274, 876-901. Winter (2001) An Introduction to Igneous and Metamorphic Petrology. Prentice Hall.
Chapter 30: Metamorphic Fluids & Metasomatism Figure 30-25. Al2O3-CaO-(FeO+MgO) diagram (projected from K2O) showing the mineral phases and calculated bulk compositional path for metasomatic zones that develop at the contact between pelitic and carbonate layers near Lake Willoughby, VT. Ideal mineral compositions are in gray, real ones in black. After A. B. Thompson (1975) J. Petrol., 16, 314-346. Plus signs represent analyzed bulk-rock compositions within zones. Winter (2001) An Introduction to Igneous and Metamorphic Petrology. Prentice Hall.
Chapter 30: Metamorphic Fluids & Metasomatism Figure 30-26. Schematic CaO-MgO-SiO2-CO2-H2O diagram showing the composition of the fluid solution in equilibrium with the phases shown at approximately 600oC and 0.2 GPa (projected from H2O and CO2 at a constant 1:1 ratio). After Frantz and Mao (1976) Amer. J. Sci., 276, 817-840. Winter (2001) An Introduction to Igneous and Metamorphic Petrology. Prentice Hall.
a 1 cm Chapter 30: Metamorphic Fluids & Metasomatism b 1 cm Figure 30-27.a. Metasomatic zones separating quartz diorite (bottom) from marble (top). Zonation corresponds to third row from bottom in Table 30-1. b. Symmetric metasomatic vein in dolomite. Zonation corresponds to last row in Table 30-1. Adamello Alps. After Frisch and Helgeson (1984) Amer. J. Sci., 284, 121-185. Photos courtesy of Hal Helgeson. Winter (2001) An Introduction to Igneous and Metamorphic Petrology. Prentice Hall.
Chapter 30: Metamorphic Fluids & Metasomatism Figure 30-28. Mineral zones and modes developed at the contact between quartz diorite and dolomitic marble in Figure 30-26a. Initial contact may be at either side of the contact zone. Index numbers at the top indicate the locations of bulk chemical analyses. After Frisch and Helgeson (1984) Amer. J. Sci., 284, 121-185. Winter (2001) An Introduction to Igneous and Metamorphic Petrology. Prentice Hall.
Chapter 30: Metamorphic Fluids & Metasomatism Figure 30-29.a. log aCaO - log aSiO2 diagram in the system CaO-MgO-SiO2-H2O-CO2 at 425oC, 0.05 GPa, and XCO2= 0.007. Numbered points correspond to the index numbers in Figure 30-27. After Frisch and Helgeson (1984) Amer. J. Sci., 284, 121-185. Winter (2001) An Introduction to Igneous and Metamorphic Petrology. Prentice Hall.
Chapter 30: Metamorphic Fluids & Metasomatism Figure 30-29.b. log aCaO - log aMgO diagram in the system CaO-MgO-SiO2-H2O-CO2 at 425oC, 0.05 GPa, and XCO2= 0.007. Numbered points correspond to the index numbers in Figure 30-27. After Frisch and Helgeson (1984) Amer. J. Sci., 284, 121-185. Winter (2001) An Introduction to Igneous and Metamorphic Petrology. Prentice Hall.
Chapter 30: Metamorphic Fluids & Metasomatism Figure 30-29 c. log aCaO - log aSiO2 diagram for the system CaO-MgO-SiO2 -Al2O3 -H2O-CO2 at 425oC, 0.05 GPa, and XCO2= 0.007. Numbered points correspond to the index numbers in Figure 30-27. After Frisch and Helgeson (1984) Amer. J. Sci., 284, 121-185. Winter (2001) An Introduction to Igneous and Metamorphic Petrology. Prentice Hall.
Chapter 30: Metamorphic Fluids & Metasomatism Figure 30-30. Zonation in an experimental skarn formed at the contact between granodiorite and limestone at 600oC, Pfluid = 0.1 GPa (XCO2 = 0.07). After Zharikov, V.A. and G.P. Zaraisky (1991) Experimental modeling of wall-rock metasomatism. In L. L Perchuck (ed.), Progress in Metamorphic and Magmatic Petrology. A Memorial Volume in Honor of D. S. Korzhinskii. Cambridge University Press. Cambridge, pp. 197-245. Photo courtesy G. Zaraisky. Winter (2001) An Introduction to Igneous and Metamorphic Petrology. Prentice Hall.