Download
1 / 7
70 likes | 218 Views
Summer Portfolio Institute 2002. "Integration of Graphing Calculators". My name is Teri Huling and I worked with incorporating the graphing calculators into the portfolio institute.

E N D
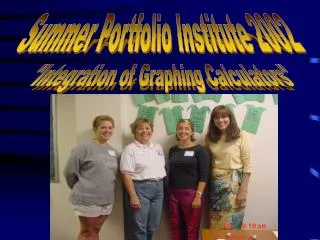
Summer Portfolio Institute 2002 "Integration of Graphing Calculators"
My name is Teri Huling and I worked with incorporating the graphing calculators into the portfolio institute. This is my second year participating in the Portfolio Institute and it has been completely different from last year! I have included a description of four activities I did in the camp and a reflection. A New Year... A New Adventure
Circle Graphs • Integrating circle graphs with a getting to know you activity. • Four stations were set up in the room: hobbies, siblings, sports, and birthdays. • We used a program on the graphing calculator to give us the percentage of the class that (for example had a dog). • The circle graph to the left was used as a demonstration on how to use the graphing program. • Fifty percent of the class had brown hair, 16.6% were blondes, and 33.3% had black hair. Hair Color
Motion Detectors(Ranger/Hiker) • All four classes had an opportunity to work with the motion detectors. • There was one class that came up with the right idea on how to create a step graph, the other classes needed a little guidance. I think that the graph turned out very well. • This lesson was a favorite for many of the students, it allowed them to see there walking results immediately.
Heart Rate Monitors • All the classes worked with the heart rate monitors as well, some a little more extensively than others. • Some used the data collected from the monitors to introduce scatter plots and line of best fit on the graphing calculator. • The students took their heart rate at rest and after exercise. (jumping jacks) • We found that where you placed the ear clip affected the data. Some people got better readings on their ears, fingers, or neck. • All classes did some type of data collection. Beats per Minute
Flower graphs with Polar functions • This activity was probably the kids second favorite on the graphing calculator. • The kids created geometric shapes with polar functions, and they saw a pattern evolve depending on how many petals were on the flower. • They were also given the general equation and discovered how the graph changed when a variable was put in front of the function. • Many students created their own designs.
Reflections • The past week has been a great learning experience. I definitely feel more comfortable with working on the graphing calculators. • I want to thank all the teachers who took time to help me team-teach a lesson. Your contribution was much appreciated.