Download
1 / 19
190 likes | 337 Views
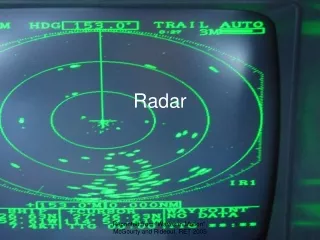
Bathymetric Radar. Presented by David B. Enabnit Technical Director, Office of Coast Survey, NOAA. Bathymetric Radar Concept. 1. Common marine X-Band radar is used to image the ocean waves. 2. Using computer processing, extract the wave speed and wave length from the sea clutter image.

E N D
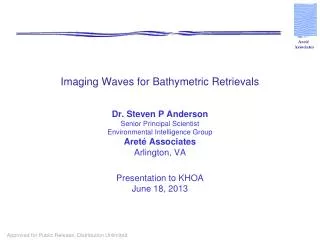
Bathymetric Radar Presented by David B. Enabnit Technical Director, Office of Coast Survey, NOAA
Bathymetric Radar Concept 1. Common marine X-Band radar is used to image the ocean waves. 2. Using computer processing, extract the wave speed and wave length from the sea clutter image 4. Solve the dispersion relation for depth. 3. The ‘dispersion relation’ for water waves relates wave speed, wave length and water depth. Speed = √(gλ/2π)tanh(2πDepth/ λ)
Bathymetric Radar • Technical performance indicates Bathymetric Radar could deliver improved information for navigation. • A body of knowledge and a research community exits. • The entry cost should be affordable. • It will have significant shortcomings initially. • Research and patience will be required.
Charting Model Comparison Traditional Charting Practices • Soundings are many years old • Charted depths are “adjusted” for many reasons • Further “adjustments” are made by mariners • Other situation information is not provided, e.g. currents Radar Bathymetry-Based Model • Provides real-time total water depths • No mariner adjustments needed • Additional real-time navigation situation information • Reduces data collection costs and time substantially • Supports traditional charting practices also
Alternative Operational Concepts • Permanent installations • Measure all parameters in real-time; process data ‘in the cloud’; transmit results to ships • Also use data later for chart compilation • Semi-mobile installations • Move to site of interest, install, survey, move to next site • Small boat or land installation • Use like traditional survey; post-process data for chart compilation • Ship-based installations • Use like traditional survey; post-process data for chart compilation
A Future Chart Concept Bathy Radar NOAA Computer Center or ‘the Cloud’ ECDIS 2.0 (Chart of the Future)
Bathymetric RadarPotential Real-Time Data Sets • Real-time data: • Total water depth • Waves • Surface currents • Vessel traffic • Buoy location • Bridge clearance • Tides • Wind • Oil spills • Ice • Other factors: • Works day or night • Works in rain or fog • No ship required • Radars are cheap and mature • Potentially usable from moving platform • EPFS backup • Supports traditional charting
Demonstrated Bathymetric Radar Performance † • Performance • 5 KM range • Horizontal resolution of • 2 to 3 times the depth • 3-20 m depth range • Depth accuracy 0.25m for d<10m; 2.5% of depth for 10m<d<20m • 10 min. duty cycle • 3 knot minimum wind † Using linear wave theory
Bathymetric RadarPotential Limitations • Suitable waves must be present • The horizontal resolution is worse than sonar • Range limit of approximately 5 Km • Shallow water tool (2-20 meters) • Radar should be on an elevated platform • Currents might need to be accounted for • Ice defeats waves • Isolated dangers may not be detected • Channel slopes may not image correctly • Still developmental
Current Activity • Team building • Build list of scientific research questions • Performance baseline experiment • Determine technical feasibility • Consider operational scenarios • Secure funding
Technical Approach • Determine bathymetric radar technical feasibility • Produce algorithms to compute water depth and position from X-Band radar signals • Measure the precision, accuracy, depth and position resolution, and maximum and minimum depths achieved • Compare the achieved results with sonar survey and with standards for hydrographic surveys • Identify science needed to achieve standards-compliant data • Evaluate as an operational tool • Use SBIR† to engage industry • Use NOAA for ground truth and additional analysis † Small Business Innovate Research program
Schedule Using the SBIR† Phase I and II • Sept. 2013 – SBIR Phase I contract selection • Nov. 2013 to June 2014 – Feasibility experiments and radar bathymetry evaluation. • Mar. 2014 to June 2017– Follow-on research specification and initiate execution. • Nov. 2014 to May 2015 – SBIR Phase II competition and award for an operational prototype. • Sept. 2017 – SBIR Phase II completion. Operational deployments begin. † Small Business Innovate Research program
Outcome of KHOA/KIOST/NOAA Collaboration Technical knowledge An informed assessment of the operational potential for bathymetric radar Partial fulfillment of the JPA purposes Goal of KHOA/KIOST/NOAA Collaboration An operational, bathymetric radar system providing real-time, comprehensive, decision-ready information to mariners
Risks and Risk Mitigation • Scientific risk – reduce through research like JPA project • Environmental risk – reduce through early operations research, e.g. GIS suitability analysis • Distribution risk – reduce by performing Internet ‘connectivity’ mapping • Regulatory risk – reduce by collaboration with regulatory bodies, e.g. Maritime Safety Administrations, IMO • Operational risk – Manage through establishment of standard operating procedures and cloud-based software • Liability risk - Manage as appropriate • Funding risk – Increase number of participants
Suitability Analysis – Southern California • Archived wind & wave data from 2012 was gathered from buoys and wind observing stations • Binary classification of all observations (1=suitable, 0=unsuitable); suitable obs divided by total obs to give suitability percentage for each variable at each point for the entire year • Raster data surfaces interpolated from point data representing suitability • percentage for each variable • Grid values for each variable were summed, with no weighting, & reclassified resulting in combined suitability(scale of 10 – 20) with higher values being more suitable • Very favorable conditions near Port of S.D. & moderate to good BathyRadar suitability near L.A. & L.B. BathyRadar combined suitability values within 0 – 20m water depth zones near 3 California ports of http://www.terpconnect.umd.edu/~ngarret1/Capstone/WebPage/research.html
Opportunities for KHOA/KIOST Participation • Review the SBIR proposals (completed) • Collaborate on the development of the experiment plan • Develop scientific expertise in bathymetric radar • Review the experiment results • Identify needed scientific research • Perform an independent analysis of the radar data • Perform operations research on supporting topics, e.g. GIS suitability analysis • Recruit interested parties such as Korean radar companies • Support the effort as a JPA-funded activity • Provide oversight of the work
Other Topics • KHOA/KIOST concerns, motivations and desired outcomes • Intellectual property rights • Working under the JPA and upcoming JPA meeting (July 2013) • KHOA/KIOST ability to participate directly? • Travel • Electronic conferencing support
Contact Information David B. Enabnit Technical Director (N/CSx1) Office of Coast Survey, NOAA 1315 East West Highway Silver Spring, Maryland, 20910 USA (e-mail) dave.enabnit@noaa.gov (phone) 301-713-2770 x132 (fax) 301-713-4019
Evolving Navigation Support • Information – static collection of reference material • Charts and publications; Marine Information Overlays • Situation – where you are, what’s around you, what’s happening or likely to happen • Real-time position; Alarms ; AIS • Procedure – tools to do things • Route and voyage planning tools; Reporting tools, e.g. NOAD • Decision – synthesize information into advice • From the U.S. Coast Pilot “The numerous snags along the creek can be avoided by staying in midstream, and the island 0.3 mile above the mouth should be kept to the north.” • Route optimization