Download
1 / 117
1.2k likes | 1.78k Views
Managing Risk: A Governance Perspective. Aswath Damodaran. Risk is ubiquitous… and has always been around. Risk has always been part of human existence. In our earliest days, the primary risks were physical and were correlated with material reward.

E N D
Managing Risk:A Governance Perspective Aswath Damodaran
Risk is ubiquitous… and has always been around • Risk has always been part of human existence. In our earliest days, the primary risks were physical and were correlated with material reward. • With the advent of shipping and trade, we began to see a separation between physical risk and economic rewards. While seamen still saw their rewards linked to exposure to physical risk – scurvy, pirates and storms – wealthy merchants bet their money on ships returning home with bounty. • With the advent of financial markets and the growth of the leisure business, we have seen an even bigger separation between physical and economic risks.
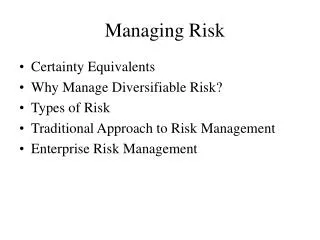
Agenda • What is risk? • Why do we care about risk? • How do we measure risk? • How do we deal with risk in analysis? • How should we manage risk?
Task 1: Defining Risk • How would you define risk? • Given your definition of risk, how would you measure risk? • Given your definition and measure of risk, what do you see as the objective of risk management? • Reduce exposure to all risk • Reduce exposure to “bad” risk • Increase exposure to “good” risk • Reduce exposure to bad risk and increase exposure to good risk • In your firm, how is risk management defined and organized? Does it match up to the objective you chose in the last question?
The slippery response… playing with words.. • In 1921, Frank Knight distinguished between risk and uncertainty by arguing if uncertainty could be quantified, it should be treated as risk. If not, it should be considered uncertainty. • As an illustration, he contrasted two individuals drawing from an urn of red and black balls; the first individual is ignorant of the numbers of each color whereas the second individual is aware that there are three red balls for each black ball. The first one, he argued, is faced with uncertainty, whereas the second one is faced with risk. • The emphasis on whether uncertainty is subjective or objective seems to us misplaced. It is true that risk that is measurable is easier to insure but we do care about all uncertainty, whether measurable or not.
More risk semantics… • Risk versus Probability: While some definitions of risk focus only on the probability of an event occurring, more comprehensive definitions incorporate both the probability of the event occurring and the consequences of the event. • Risk versus Threat: A threat is a low probability event with very large negative consequences, where analysts may be unable to assess the probability. A risk, on the other hand, is defined to be a higher probability event, where there is enough information to make assessments of both the probability and the consequences. • All outcomes versus Negative outcomes: Some definitions of risk tend to focus only on the downside scenarios, whereas others are more expansive and consider all variability as risk.
Here is a good definition of risk… • Risk, in traditional terms, is viewed as a ‘negative’. Webster’s dictionary, for instance, defines risk as “exposing to danger or hazard”. The Chinese symbols for crisis, reproduced below, give a much better description of risk. • The first symbol is the symbol for “danger”, while the second is the symbol for “opportunity”, making risk a mix of danger and opportunity.
Stories abound about why the party will not end… • When a market is booming, there are beneficiaries from the boom whose best interest require that the boom continue. • When the price rise becomes unsustainable or unexplainable using current metrics, there will be many who try to explain it away using one of three tactics: • Distraction: Telling a big story that may be true at its essence but that cannot be connected to prices. • “The paradigm shift”: Arguing that the rules have changed and don’t apply any more.
Followed by ex-post rationalization… • The same analysts who talked about paradigm shifts and used the big story now are perfectly sanguine about explaining why the correction had to happen. • The defenses/ rationalizations vary but can be categorized into the following: • Don’t blame me. Everyone else messed up too. • This is what I thought would happen all along. I just never got around to saying it. • Distraction: Spin another big story to counter the previous one.
Lesson 2: Risk management ≠ Risk hedging.. • For too long, we have ceded the definition and terms of risk management to risk hedgers, who see the purpose of risk management as removing or reducing risk exposures. This has happened because • the bulk of risk management product, which are revenue generators, are risk hedging products, be they insurance, derivatives or swaps. • it is human nature to remember losses (the downside of risk) more than profits (the upside of risk); we are easy prey, especially after disasters, calamities and market meltdowns for purveyors of risk hedging products. • the separation of management from ownership in most publicly traded firms creates a potential conflict of interest between what is good for the business (and its stockholders) and for the managers. Managers may want to protect their jobs by insuring against risks, even though stockholders may gain little from the hedging. • Risk management, defined correctly, has to look at both the downside of risk and the upside. It cannot just be about hedging risk.
Let’s start with a simple experiment • I will flip a coin once and will pay you a dollar if the coin came up tails on the first flip; the experiment will stop if it came up heads. • If you win the dollar on the first flip, though, you will be offered a second flip where you could double your winnings if the coin came up tails again. • The game will thus continue, with the prize doubling at each stage, until you come up heads. How much would you be willing to pay to partake in this gamble? • Nothing • <$2 • $2-$4 • $4-$6 • >$6
The Bernoulli Experiment and the St. Petersburg Paradox • This was the experiment run by Nicholas Bernoulli in the 1700s. While the expected value of this series of outcomes is infinite, he found that individuals paid, on average, about $2 to play the game. • He also noticed two other phenomena: • First, he noted that the value attached to this gamble would vary across individuals, with some individuals willing to pay more than others, with the difference a function of their risk aversion. • His second was that the utility from gaining an additional dollar would decrease with wealth; he argued that “one thousand ducats is more significant to a pauper than to a rich man though both gain the same amount”.
The Von-Neumann Morgenstern Construct.. • Rather than think in terms of what it would make an individual to take a specific gamble, they presented the individual with multiple gambles or lotteries with the intention of making him choose between them. • They based their arguments on five axioms • Comparability or completeness, Alternative gambles be comparable and that individuals be able to specify their preferences for each one • Transitivity: If you prefer A to B and B to C, you prefer A to C. • Independence: Outcomes in each lottery or gamble are independent of each other. • Measurability: The probability of different outcomes within each gamble be measurable with a number. • Ranking axiom, If an individual ranks outcomes B and C between A and D, the probabilities that would yield gambles on which he would indifferent have to be consistent with the rankings.
And the consequences.. • What these axioms allowed Von Neumann and Morgenstern to do was to derive expected utility functions for gambles that were linear functions of the probabilities of the expected utility of the individual outcomes. In short, the expected utility of a gamble with outcomes of $ 10 and $ 100 with equal probabilities can be written as follows: E(U) = 0.5 U(10) + 0.5 U(100) • Extending this approach, we can estimate the expected utility of any gamble, as long as we can specify the potential outcomes and the probabilities of each one. • Everything we do in conventional economics/finance follows the Von Neumann-Morgenstern construct.
Measuring Risk Aversion • Certainty Equivalents: In technical terms, the price that an individual is willing to pay for a bet where there is uncertainty and an expected value is called the certainty equivalent value. The difference between the expected value and your certainty equivalent is a measure of risk aversion. • Risk Aversion coefficients: If we can specify the relationship between utility and wealth in a function, the risk aversion coefficient measures how much utility we gain (or lose) as we add (or subtract) from our wealth.
Evidence on risk aversion • Experimental studies: We can run controlled experiments, offering subjects choices between gambles and see how they choose. • Surveys: In contrast to experiments, where relatively few subjects are observed in a controlled environment, survey approaches look at actual behavior – portfolio choices and insurance decisions, for instance- across large samples. • Pricing of risky assets: The financial markets represent experiments in progress, with millions of subjects expressing their risk preferences by how they price risky assets. • Game shows, Race tracks and Gambling: Over the last few decades, the data from gambling events has been examined closely by economists, trying to understand how individuals behave when confronted with risky choices.
a. Experimental Studies: We are risk averse, but there are differences across people • Male versus Female: Women, in general, are more risk averse than men. However, while men may be less risk averse than women with small bets, they are as risk averse, if not more, for larger, more consequential bets. • Naïve versus Experienced: A study compared bids from naïve students and construction industry experts for an asset and found that while the winner’s curse was prevalent with both, students were more risk averse than the experts. • Young versus Old: Risk aversion increases as we age. In experiments, older people tend to be more risk averse than younger subjects, though the increase in risk aversion is greater among women than men. In a related finding, single individuals were less risk averse than married individuals, though having more children did not seem to increase risk aversion. • Racial and Cultural Differences: The experiments that we have reported on have spanned the globe from rural farmers in India to college students in the United States. The conclusion, though, is that human beings have a lot more in common when it comes to risk aversion than they have as differences
With some strange quirks… • Framing: Would you rather save 200 out of 600 people or accept a one-third probability that everyone will be saved? While the two statements may be mathematically equivalent, most people choose the first. • Loss Aversion: Would you rather take $ 750 or a 75% chance of winning $1000? Would you rather lose $750 guaranteed or a 75% chance of losing $ 1000? • Myopic loss aversion: Getting more frequent feedback on where they stand makes individuals more risk averse. • House Money Effect: Individuals are more willing to takes risk with found money (i.e. money obtained easily) than with earned money. • The Breakeven Effect: Subjects in experiments who have lost money seem willing to gamble on lotteries (that standing alone would be viewed as unattractive) that offer them a chance to break even.
b. Surveys: The tools… • Investment Choices: By looking at the proportion of wealth invested in risky assets and relating this to other observable characteristics including level of wealth, researchers have attempted to back out the risk aversion of individuals. Studies using this approach find evidence that wealthier people invest smaller proportions of their wealth in risky assets (declining relative risk aversion) than poorer people. • Questionnaires: In this approach, participants in the survey are asked to answer a series of questions about the willingness to take risk. The answers are used to assess risk attitudes and measure risk aversion.. • Insurance Decisions: Individuals buy insurance coverage because they are risk averse. A few studies have focused on insurance premia and coverage purchased by individuals to get a sense of how risk averse they are.
And the findings.. • Individuals are risk averse, though the studies differ on what they find about relative risk aversion as wealth increases. • Surveys find that women are more risk averse than men, even after controlling for differences in age, income and education. • The lifecycle risk aversion hypothesis posits that risk aversion should increase with age, but surveys cannot directly test this proposition, since it would require testing the same person at different ages. In weak support of this hypothesis, surveys find that older people are, in fact, more risk averse than younger people because they tend to invest less of their wealth in riskier assets.
c. Pricing of Risky Assets • Rather than ask people how risk averse they are or running experiments with small sums of money, we can turn to an ongoing, real time experiment called financial markets, where real money is being bet on real assets. • Consider a simple proposition. Assume that an asset can be expected to generate $ 10 a year every year in perpetuity. How much would you pay for this asset, if the cash flow is guaranteed? • Now assume that the expected cash flow is uncertain and that the degree of uncertainty is about the same as the uncertainty you feel about the average stock in the market. How much would you pay for this asset?
d. Game Shows/Gambling Arenas: • The very act of gambling seems inconsistent with risk aversion but it can be justified by arguing that either individuals enjoy gambling or that the potential for a large payoff outweighs the negative odds. • The key finding is what is termed as the long shot bias, which refers to the fact that people pay too much for long shots and too little for favorites. • This long shot bias has been explained by arguing that • Individuals underestimate large probabilities and overestimate small probabilities. • Betting on long shots is more exciting and that excitement itself generates utility for individuals. • There is a preference for very large positive payoffs, i.e. individuals attach additional utility to very large payoffs, even when the probabilities of receiving them are very small.
In summary • Individuals are generally risk averse, and are more so when the stakes are large than when they are small. There are big differences in risk aversion across the population and significant differences across sub-groups. • There are quirks in risk taking behavior • Individuals are far more affected by losses than equivalent gains (loss aversion), and this behavior is made worse by frequent monitoring. • The choices that people when presented with risky choices or gambles can depend upon how the choice is presented (framing). • Individuals tend to be much more willing to take risks with what they consider “found money” than with earned money (house money effect). • There are two scenarios where risk aversion seems to be replaced by risk seeking. One is when you have the chance of making an large sum with a very small probability of success (long shot bias). The other is when you have lost money are presented with choices that allow them to make their money back (break even effect).
An alternative to traditional risk theory:Kahneman and Tversky to the rescue a. Framing: Decisions are affected by how choices are framed, rather than the choices themselves. Thus, if we buy more of a product when it is sold at 20% off a list price of $2.50 than when it sold for a list price of $2.00, we are susceptible to framing. b. Nonlinear preferences: If an individual prefers A to B, B to C, and then C to A, he or she is violating a key axiom of standard preference theory (transitivity). In the real world, there is evidence that this type of behavior is not uncommon. c. Risk aversion and risk seeking: Individuals often simultaneously exhibit risk aversion in some actions while seeking out risk in others. d. Source: The mechanism through which information is delivered may matter, even if the product or service is identical. For instance, people will pay more for a good, based upon how it is packaged, than for an identical good, even though they plan to discard the packaging instantly after the purchase. e. Loss Aversion: Individuals seem to fell more pain from losses than from equivalent gains. Individuals will often be willing to accept a gamble with uncertainty and an expected loss than a guaranteed loss of the same amount.
The Value Function • The implication is that how individuals behave will depend upon how a problem is framed, with the decision being different if the outcome is framed relative to a reference point to make it look like a gain as opposed to a different reference point to convert it into a loss.
Task 2: How risk averse are you? • How risk averse are you? • More risk averse than my colleagues • About as risk averse as my colleagues • Less risk averse than my colleagues • If you are more or less risk averse than your colleagues, how does this difference manifest itself in your decision-making and discussions? • It does not affect either decisions or discussions • I am usually the cautious one, pushing every one else to slow down or to stop risky actions. • I am usually the aggressive one, trying to get every one else to move quicker and take more risky actions.
I. Probabilities… • The Pacioli Puzzle: In 1394, Luca Pacioli, a Franciscan monk, posed this question: Assume that two gamblers are playing an even odds, best of five dice game and are interrupted after three games, with one gambler leading two to one. What is the fairest way to split the pot between the two gamblers, assuming that the game cannot be resumed but taking into account the state of the game when it was interrupted? • It was not until 1654 that the Pacioli puzzle was fully solved when Blaise Pascal and Pierre de Fermat exchanged a series of five letters on the puzzle. In these letters, Pascal and Fermat considered all the possible outcomes to the Pacioli puzzle and noted that with a fair dice, the gambler who was ahead two games to one in a best-of-five dice game would prevail three times out of four, if the game were completed, and was thus entitled to three quarters of the pot. In the process, they established the foundations of probabilities.
II. To Statistical Distributions.. • Abraham de Moivre, an English mathematician of French extraction, introduced the normal distribution as an approximation as sample sizes became large.
III. To Actuarial Tables and the Birth of Insurance.. • In 1662, John Graunt created one of the first mortality tables by counting for every one hundred children born in London, each year from 1603 to 1661, how many were still living. He estimated that while 64 out of every 100 made it age 6 alive, only 1 in 100 survived to be 76. • The advances in assessing probabilities and the subsequent development of statistical measures of risk laid the basis for the modern insurance business. • In the aftermath of the great fire of London in 1666, Nicholas Barbon opened “The Fire Office”, the first fire insurance company to insure brick homes. Lloyd’s of London became the first the first large company to offer insurance to ship owners.
IV. Financial Assets and Statistical Risk Measures.. • When stocks were first traded in the 18th and 19th century, there was little access to information and few ways of processing even that limited information in the eighteenth and nineteenth centuries. • By the early part of the twentieth century, services were already starting to collect return and price data on individual securities and computing basic statistics such as the expected return and standard deviation in returns. • By 1915, services including the Standard Statistics Bureau (the precursor to Standard and Poor’s), Fitch and Moody’s were processing accounting information to provide bond ratings as measures of credit risk in companies.
V. The Markowitz Revolution • Markowitz noted that if the value of a stock is the present value of its expected dividends and an investor were intent on only maximizing returns, he or she would invest in the one stock that had the highest expected dividends, a practice that was clearly at odds with both practice and theory at that time, which recommended investing in diversified portfolios. • Investors, he reasoned, must diversify because they care about risk, and the risk of a diversified portfolio must therefore be lower than the risk of the individual securities that went into it. His key insight was that the variance of a portfolio could be written as a function not only of how much was invested in each security and the variances of the individual securities but also of the correlation between the securities.
VII. The Challenges to Risk and Return Models: The real world is not normally distributed… Stock prices sometimes jump Return distributions are not symmetric Distributions have much fatter tails
Task 3: Assessing risk in your firm • If your firm is publicly traded: • Is your equity (stock) viewed as a safe, average or risky stock? (Find some measures of risk on your stock that are publicly accessible, such as beta and standard deviation). • Is your debt (bonds) viewed as safe, average or risky? (Again, see if you can find a measure of bond risk; this can take the form of a bond rating if you are a larger, multinational firm but it can be also extracted by looking at interest rates that banks charge you for lending you money) • Is this consistent with how you view your firm’s risk? If not, why do you think there is a difference? • Has the riskiness of your firm changed over time? Do you think that the market measures of risk reflect these changes? • If your firm is not publicly traded, do you think your firm is safer or riskier than the average firm? What do your base this assessment on?
How do we deal with risk in decision making? Tools and Techniques for risk assessment
Ways of dealing with risk in analysis • Risk Adjusted Value • Estimate expected cash flows and adjust the discount rate for risk • Use certainty equivalent cash flows and use the riskfree rate as the discount rate • Hybrid approaches • Probabilistic Approaches • Sensitivity Analysis • Decision Trees • Simulations • Value at Risk (VAR) and variants
I. Risk Adjusted Value • The value of a risky asset can be estimated by discounting the expected cash flows on the asset over its life at a risk-adjusted discount rate: where the asset has a n-year life, E(CFt) is the expected cash flow in period t and r is a discount rate that reflects the risk of the cash flows. • Alternatively, we can replace the expected cash flows with the guaranteed cash flows we would have accepted as an alternative (certainty equivalents) and discount these at the riskfree rate: where CE(CFt) is the certainty equivalent of E(CFt) and rf is the riskfree rate.
a. Risk Adjusted Discount Rates Step 1: Estimate the expected cash flows from a project/asset/business. If there is risk in the asset, this will require use to consider/estimate cash flows under different scenarios, attach probabilities to these scenarios and estimate an expected value across scenarios. In most cases, though, it takes the form of a base case set of estimates that capture the range of possible outcomes. Step 2: Estimate a risk-adjusted discount rate. While there are a number of details that go into this estimate, you can think of a risk-adjusted discount rate as composed of two components Risk adjusted rate = Riskfree Rate + Risk Premium Step 3: Take the present value of the cash flows at the risk adjusted discount rate.