Download
1 / 3
30 likes | 135 Views
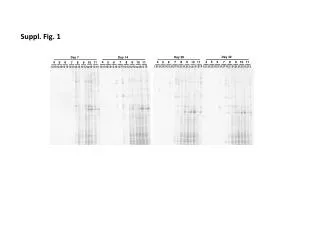
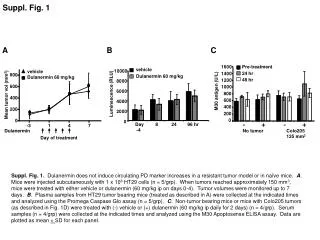
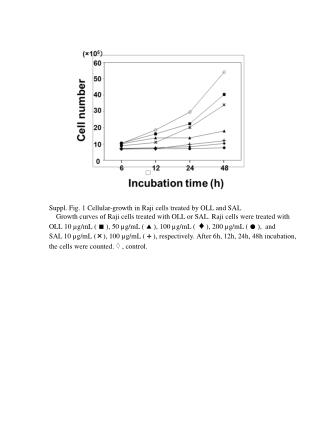
Suppl. Fig . 1 Cellular-growth in Raji cells treated by OLL and SAL Growth curves of Raji cells treated with OLL or SAL. Raji cells were treated with OLL 10 µg/mL ( ■ ), 50 µg/mL ( ▲ ), 100 µg/mL ( ♦ ), 200 µg/mL ( ● ), and

E N D
Suppl. Fig. 1 Cellular-growth in Raji cells treated by OLL and SAL Growth curves of Raji cells treated with OLL or SAL. Raji cells were treated with OLL 10 µg/mL ( ■), 50 µg/mL ( ▲ ), 100 µg/mL ( ♦ ), 200 µg/mL ( ● ), and SAL 10 µg/mL (×), 100 µg/mL ( + ), respectively. After 6h, 12h, 24h, 48h incubation, the cells were counted. ◊ , control.
Suppl. Fig. 2 Expression of cytokine genes in Raji cells treated by SAL Total RNAs were extracted from SAL-treated and –untreated Raji cells, and then subjected to quantitative RT-PCR performed with primers specific for IFN-γ, TNF-α, IL-1β, IL-6, IL-10, IL-12B and glyceraldehyde 3-phosphate dehydrogenase (GAPDH) (control). The copy numbers of candidate gene mRNA were standardized against that of GAPDHin each sample. Data, expressed as relative amounts, represents the mean value ±S.E. for two independent experiment. Cytokine gene / GAPDH low low N.D. N.D. INF-γ TNF-α IL-1β IL-6 IL-10 IL-12B
Suppl. Table 1 Crossing Point Values of Detection of TNFR1 / 2 genes in Raji cells Average of crossing point valuea) Genes TNFR1 26.84 ± 0.76 TNFR2 31.18 ± 0.17 GAPDHb) 20.01 ± 0.61 Crossing point values are obtained from the Light cycler 480 software Ver. 1.2, representing the PCR cycle at which an increase in fluorescence intensity above a base line signal is first detected. Each value represents the mean value ± S.E. for three different experiments performed in duplicate. b) Control gene: glyceraldehyde 3-phosphate dehydrogenase (GAPDH).