Download
1 / 22
220 likes | 357 Views
Characterization of Toxic Chemicals in Puget Sound and Major Tributaries. Tom Gries and David Osterberg Washington State Department of Ecology. Introduction. Puget Sound Toxics Loading Analysis Compiled relevant information, estimated loads, identified data gaps

E N D
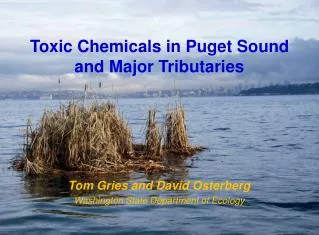
Characterization ofToxic Chemicals in Puget Sound and Major Tributaries Tom Gries and David Osterberg Washington State Department of Ecology
Introduction • Puget Sound Toxics Loading Analysis • Compiled relevant information, estimated loads, identified data gaps • Developed box model for transport and fate of toxic chemicals (e.g., PCBs) • Estimated loading after land use-based water quality monitoring in two watersheds(Wed 6A) • Estimated loading from ocean exchange and from monitoring near mouths of major rivers • Synthesis(Platform session 1A)
Objectives • Measure concentrations of toxic chemicals in and entering Puget Sound • To reduce uncertainty of Box Model outputs → • To calibrate Box Model • Assess spatial and temporal variability • Estimate loads
Sampling Design: Marine Waters Collected water samples from: • 7 stations • 2 depths/station • 3 seasons
Sampling Design: Marine SPM • Collected SPM in sediment traps • Moored at 5 sites • Trap array at 1-2 depths • Nov 2009 to Jan 2010
Sampling Design – Major Rivers • Collect depth-integrated samples from 3 quarter points in each channel • Collect surface grabsfor petroleum-related compounds
Results: Marine Water Column • TSS, organic carbon, and metals similar to other studies; most organics seldom detected • POC, total zinc, and PBDEs most variable • Total PCBs < recent Canadian study • Total PBDEs often 10X Canadian study
Results: Spatial Variability • DOC, copper, lead, PCBs: PS > OB • Cadmium: ocean boundary > Puget Sound
Results: Spatial Variability • Deep > Surface • Arsenic, total lead • Total PCBs → • Surface > Deep • DOC in ocean boundary waters
Results: Ocean Exchange • Boundaries • Admiralty Inlet • Deception Pass • 2-layer circulation • Deep water flows into Puget Sound • Surface water flows out of Puget Sound • Net exchange = Mass exported – Mass imported • Mass exported = volume out x flow-weighted concentrations of surface layer at Main, Whidbey and Hood Canal basin sites • Mass imported = volume into Puget Sound x concentrations of deep layer at Haro Strait and San Juan de Fuca sites
Results: Ocean Exchange • Based on model-predicted water fluxes and25th-75th percentile concentrations … • Most parameters exported • Cadmium and lead imported
Conclusions General • Concentrations of toxics low in marine waters and near mouths of rivers • Concentrations of non-halogenated organics seldom detected in whole water • Organics detected more frequently in samples of SPM
Conclusions (continued) Marine waters • Concentrations of organic carbon, and metals similar to other studies • Concentrations of toxics often greater in Puget Sound and at depth (e.g., PCBs) • PBDE concentrations high and variable • Net export of most toxic chemicals out of Puget Sound (except cadmium and lead)
Conclusions(continued) Marine SPM • Sedimentation and flux of toxic chemicals greater in basins with more developed watersheds • Chemical fluxes in Hood Canal less than in South Puget Sound (except copper) • Rates can be compared to Box Model-predicted losses via sedimentation
Conclusions (continued) River water • Concentrations of conventionals, nutrients, and metals in rivers similar to other studies • Most measured daily loads from river mouths within ranges estimated from monitoring/modeling Overall? • Results improve choice of input values for the Puget Sound Box Model and ability to calibrate it
Recommendations • To further improve estimates of external loading, sample more intensively near model boundaries and measure concentrations of most variable toxics (PBDEs) • To improve detection frequency of non-polar organic compounds, focus future sampling on collection/analysis of SPM • See details:http://www.ecy.wa.gov/biblio/1103008.html
Acknowledgments Ecology staff: Bruce Barbour, Julia Bos,Randy Coots, Karin Feddersen, Mya Keyzers, Stuart Magoon, Jim Maroncelli, Dean Momohara, Dale Norton, Greg Pelletier,Brian Pickering, Mindy Roberts, Nancy Rosenbower, Dave Serdar, Janice Sloan,John Weakland, Leon Weiks,Jeff Westerlund
Parameters Measured • Metals (dissolved and total arsenic, cadmium, copper, lead, and zinc) • Organic compounds (33 chlorinated pesticides, 55 semivolatile organics, 22 PAHs, 209 PCB congeners, 26 PBDE congeners) • Conventional parameters (total suspended solids, dissolved and total organic carbon) • Nutrients (nitrogen and phosphorus), hardness, and petroleum-related compounds (TPH and oil and grease) in river water only
Results: Marine Water Column • Total PCB Concentrations • Range 6.9-75.1 pg/L (mean = 26.3 pg/L) • Puget Sound (30.7 pg/L) > Ocean Boundary (20.4 pg/L) • Ocean boundary < Dangerfield et al, 2007 (42 pg/L) • Deep layer (32.7 pg/L) > surface layer (15.1 pg/L) • Total PBDEs • Detection frequency <25% • Range 50-19,000 pg/L (mean = 2900 pg/L) • Measured concentrations highly variable • 6/10 detections and two highest concentrations from ocean boundary sites • Results often 10X greater than Dangerfield et al study
River SPM Results • Detection frequency 20% for petroleum-related compounds, semivolatile organics, and chlorinated pesticides • 16 of 22 PAHs measured routinely detected in SPM with 30-210 µg/Kg TPAH (mean = 120 µg/Kg) • Mean PCBs = 410 ng/Kg • Mean PBDEs = 1700 ng/Kg