Download
1 / 29
290 likes | 348 Views
This document aims to provide guidance on implementing ecological classification schemes based on biological, hydromorphological, physico-chemical, and chemical elements for all water categories. It outlines the development stages and highlights key issues such as quality elements' roles and parameters. Examples and tables illustrate the classification process from high to poor status. The text outlines stepwise approaches to determine ecological status and potential based on reference conditions, quality element deviations, and meeting ecological quality standards.

E N D
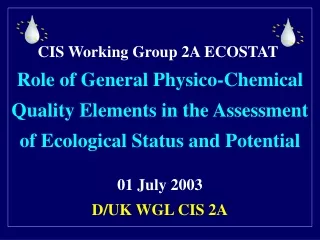
CIS Working Group 2A ECOSTAT Guidance Document on Ecological ClassificationPresentation of the Results of the 2nd Working Group Meeting15 - 17 October in Ispra/I UK/D WGL CIS 2A SCG Meeting 27 + 28.10.2003 in Brussels
Purpose of the Guidance The purpose is to provide guidance on how the Directive’s ecological classification schemes should work. For this purpose ==> all biological, hydromorphological, physico- chemical and chemical elements must be taken into account ==> all water categories (rivers, lakes etc) have to be considered not only for natural but also for artificial and heavily modified water bodies The overall guidance paper is based mainly on REFCOND, COAST, HMWB and MONITORING guidance documents !
Development of the Guidance • A 1st draft was produced by D/UK lead countries on the basis of the outcome of a drafting group meeting held on 3rd June 2003 in Brussels • A 2nd draft based on the outcome of the 1st ECOSTAT Working Group meeting on 1st July 2003 in Brussels • A 3rd draft based on the outcome of a drafting group meeting on 10th – 11th September in Brussels • A 4th draft recommended for SCG was prepared during the 2nd ECOSTAT Working Group meeting on 15th – 17th October 2003 in Ispra
What are the main Issues ? • The overall approach has to clarify: • The Roles of the Quality Elements in the Ecological Classification (Stepwise Approach) • The Roles of the General Physico-chemical Quality Elements in the Ecological Classification of Good and Moderate Status/Potential • The Roles of Parameters indicative for Quality Elements • The Achievement of adequate Confidence and Precision
Quality Elements and Parameters
Groups of Quality Elements Examples of Quality Elements Examples of indicative Parameters General physico-chemical elements Oxygenation conditions COD, BOD, DO Copper in water, biota or sediment Non-priority specific pollutants Copper discharged in significant quantities Hydromorphological elements Hydrological regime Quantity, dynamics Composition, abundance Biological elements Composition & abundance of benthic invertebrate fauna Tables Annex V Sections 1.1 and 1.2
Biological Quality Elements and Parameters Biological Quality Parameters Elements Aquatic flora* composition & abundance Phytoplankton composition, abundance & blooms Benthic invertebrates composition, abundance, sensitive taxa & diversity Fish composition, abundance, sensitive taxa & age structure * Macrophytes & phytobenthos
Parameter Level Element Level Status classification Results for the element phytobenthos Results for individual parameters of the element phytobenthos that have a general sensitivity to a range of pressures Result for water body Combine parameters (e.g. by averaging) Results for individual parameters (metrics) of the element macroinvertebrates, grouped according to the pressure to which they are sensitive Results for each group of macroinvertebrate parameters responsive to a different type of pressure One-out, all-out Result for the element macroinvertebrates Changes to hydrology One-out, all-out if signals from groups are strong enough Combine parameters (e.g. by averaging) Acidification Combine parameters (e.g. by averaging) Organic enrichment Relationship between Biological Quality Elements and Indicator Parameters and their Use in Classification Decisions
Stepwise Approach for the Ecological Classification
Do the estimated values for the biological quality elements meet reference conditions? Do the hydro-morphological conditions meet high status? Do the physico-chemical conditions meet high status? Yes Yes Yes Classify as high status No No No Do the estimated values for the biological quality elements deviate only slightly from reference condition values? Do the physico-chemical conditions (a) ensure ecosystem functioning and (b) meet the EQSs for specific pollutants? Yes Yes Classify as good status No No Classify on the basis of the biological deviation from reference conditions Yes Classify as moderate status Is the deviation moderate? Greater Yes Classify as poor status Is the deviation major? Greater Classify as bad status Relative roles of biological, hydromorphological and physico-chemical quality elements in ecological status classification
Greater Yes Is the deviation major? Classify as poor potential Greater Classify as bad potential Do the hydromorphological conditions meet MEP? MEP is met, classify as good and above potential Do the estimated values for the biological quality elements meet MEP? Yes Yes Do the physico-chemical conditions meet MEP? Yes No No No Do the estimated values for the biological quality elements deviate only slightly from MEP? Do the physico-chemical conditions (a) ensure ecosystem functioning and(b) meet the EQSs for specific pollutants? Classify as good and above potential Yes Yes No No Yes Classify on the basis of the biological deviation from MEP Classify as moderate potential Is the deviation moderate? Relative roles of biological, hydromorphological and physico-chemical quality elements in ecological potential classification
What can dictate the status class of a water body? High Status Good status Moderate Status Bad Status Poor Status Biology Biology Biology Biology Biology Physico-chemistry Physico-chemistry Hydro-morphology
General physico-chemical quality elements (e.g. nutrients) Specific pollutants (e.g. metals) Do not exceed the levels or ranges established to ensure the functioning of the ecosystem and the achievement of the good status values for the biological quality elements Not in excess of the standards set in accordance with the procedure detailed in section 1.2.6 Physico-chemical quality elements
GeneralPhysico-chemical Quality Elements Type-specific ranges and levels have to be established by MS The ranges and levels must be taken into account when assigning water bodies to the high and good ecological status class and the maximum and good ecological potential class
Concern Limits set for the general physico-chemical quality elements could result in classification as moderate status even where no biological impacts
Working Group’s Proposed Solution Use a checking procedure to test whether the limits set for a type are either: (a) MORE STRINGENT than required; or (b) INSUFFICIENTLY STRINGENT to protect the biology
Checking Procedure if the Level or Range has been Exceeded but the Biology is Good or Better
Checking Procedure 2 if the Level or Range has not been Exceeded but the Biology is Worse than Good
Learning process Is there evidence of a mismatch between the monitoring results for biology and physico-chemistry Yes Is this because the biological methods are not sufficiently sensitive? No Review the level or range, and revise, if appropriate
Refinement of levels or ranges for physico-chemical quality elements Improvements in biological methods e.g. delay in biological response Mismatches Time
Summary of how the Middle Box works
high 0 good 100 100% probability class is GOOD mod 0 poor 0 bad 0
Range of uncertainty
100 % sure status is good High Good Moderate Poor Bad
100 % sure status is worse than good High Good Moderate Poor Bad
High Good Moderate Poor Bad