Download
1 / 16
160 likes | 190 Views
Explore organizational and implementation challenges in transitioning from a product-centric to a customer-centric approach, improving interaction orientation, and maximizing customer lifetime value. Learn strategies for effective CLV implementation and overcoming obstacles in driving profitability.

E N D
Managing Customers for Profit V. Kumar Chapter – 14 Organizational and Implementation Challenges Instructor’s Presentation Slides
Organizational Issues with CLV Implementation (Business Dimension) A comparison between Product-Centric and Customer Centric Approach Source: Shah Denish et al, (2006) “The Path to Customer Centricity”, Journal of Service Research, Vol. 9, No. 2, pp 113-124.
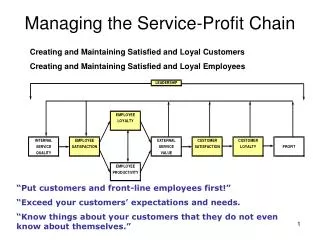
Consequences Customer Initiated Contacts Antecedents • Customer-Level Relational Performance: • Increased customer satisfaction levels • Increased Customer Ownership • Positive word of mouth • Firm Level: • Dependence on trademarks and patents Interaction Orientation • Management Level: • Employee Reward system • Outsourcing capabilities • Customer-Level Profit Performance: • Identification of profitable Customers • Acquisition and Retention of profitable customers • Conversion of unprofitable customers to profitable ones • Industry Level: • Institutional pressures • Industry Type (B2B) Competitive Intensity Interaction Orientation Process Figure 14.1 Interaction Orientation: Antecedents and Consequences Source: Kumar, V., and Girish Ramani, “Interaction Orientation: The New Measure of Marketing Capabilities”, University of Connecticut
Issues Facing Firms who do not Adopt Interaction Orientation • Obligation by the firm to continue serving a large base of unprofitable customers • Uncontrolled proliferation of negative word-of-mouth • Customers directing competitor’s attention to the firm’s vulnerable areas • Inability to plan for future • Poor marketing accountability leading to lower profits and lower returns on marketing investments
Organizational Issues with CLV Implementation (People Dimension) • Generate awareness of the need to change • This can be achieved by effective and elaborate communication with employees. • Create desire to participate and support the change • Firms can attain maximum participation by communicating the effectiveness of the initiative and the benefits that can be derived from the initiative. • Disseminate knowledge of how to change • Firms can realize this by creating channels of communication, creating information in a transparent way. • Empower ability to implement the change on a day-to-day basis • This can be done by giving the employees the power to interact and share the response to customers. • Reinforcement to keep the change in place • Firms can attain this by following up with the management and employees frequently to discuss the progress and recovering the benefits of implementing the change.
Implementation Challenges Data Driven Factors • The data should be at the customer level • The data should contain all the transaction information including past customer value, recency, frequency, contribution margin to derive the drivers of profitability • The longer the span over which the data is collected the better it is. But, the firms should collect data for at least a two to three year period. • Marketing touch information should be included in the data. The data should comprise of all the marketing touch methods used (e.g., mails, emails, etc.) and the date each touch occurred.
Shifting From Customer Spending Metric to CLV Metric (at IBM) • The firm rank-ordered its existing customer to decide which customer to target and which one to ignore. The ranking was done using CLV method. • The next step was to identify the high valued customers by understanding their specific characteristics and developing a unique marketing effort to capture those customers. This also helped the firm to identify future customers. • The firm decides on its optimal contact strategy to these highly valued customers, in terms of type and frequency of communication. • The final step includes using purchase timing and timing model that helps firms to isolate different time periods when these customers were most likely to buy these products or services.
% of Using the first 30 months of data to predict the next 18 months of Purchase Behavior Using the first 30 months of data to predict the next 18 months of purchase behavior Cohort, (Selected Customer Lifetime Past Customer Value Past Customer Value Share of Wallet Customer Spending Score (CSS) RFM RFM from top) Value 5 Average 489,541 255,885 357,265 15 Revenue 146,862 76,766 92,609 107,719 Gross Value Gross Profit 1,270 620 1,051 790 Variable Costs Variable Costs Net Profit Net Value 145,592 76,146 91,558 106,389 The reported values are in dollars (expressed as a multiple of the actual numbers) per customer and are cell medians. Shifting From Customer Spending Metric to CLV Metric (at IBM) Table 14.3 % of Cohort Selected from top) Customer Lifetime Value Average Revenue 30,427 21,789 22,622 23,542 9,184 6,659 7,185 6,966 107 114 110 104 9,077 6,544 6,856 7,081
Shifting From Customer Spending Metric to CLV Metric (at IBM) Figure 14.2 Source: Kumar, V., Rajkumar Venkatesan, Timothy Bohling and Denise Beckmann, “The Power of CLV: Managing Customer Value at IBM”, forthcoming,Marketing Science.
Shifting From Customer Spending Metric to CLV Metric (at IBM) Profit Margin by adopting CLV Framework Figure: 14.3 Percent of establishments W/Purchase Average Revenue/Customer (For the same group of customers) $16,000 40% 1.6Y% (2005) $10X (2005) $14,000 35% $12,000 30% Y% (2004) $10,000 25% $8,000 20% $6,000 15% 10% $4,000 $X (2004) $2,000 5% 0% $0 “No Touch in 2004” “Touched in 2005” Source: Kumar, V., Rajkumar Venkatesan, Timothy Bohling and Denise Beckmann, “The Power of CLV: Managing Customer Value at IBM”, forthcoming,Marketing Science.