Download
1 / 11
110 likes | 122 Views
The Obesity/Diabetes Epidemic: Perspectives, Consequences, Prevention, Treatment. Part 5. Stan Schwartz MD, FACP, FACE Private Practice, Ardmore Obesity Program Cardiometabolic Diabetes Center and Affiliate, Main Line Health System Emeritus, Clinical Associate Professor

E N D
The Obesity/Diabetes Epidemic:Perspectives, Consequences,Prevention, Treatment Part 5 Stan Schwartz MD, FACP, FACE Private Practice, Ardmore Obesity Program Cardiometabolic Diabetes Center and Affiliate, Main Line Health System Emeritus, Clinical Associate Professor University of Pennsylvania
Outline • Epidemiology and Economics of obesity/diabetes • Perspectives on Obesity • Consequences of Obesity, Prediabetes, Obesity • Obesity/ Diabetes Risk Factors, • Obesity/ Diabetes Onset can be Prevented or Delayed – Early Risk Identification and Intervention. • Medical Benefits to Weight Loss • Treatment-CDC’s diabetes prevention program and other Evidence-Based Interventions- • Basics, • Next Lecture in Series
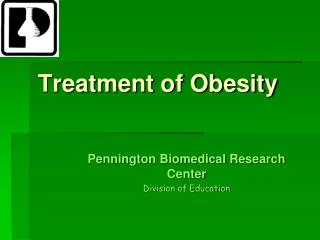
Each unit increase in BMI (about 2.7 - 3.6 kg) increases Type 2 diabetes risk by 12.1 percent 68 - 72 % of diabetes risk in the U.S. is attributable to or associated with excess weight For every kilogram increase in weight over 10 years, Type 2 diabetes risk increases 4.5 % Ford et al. Amer J Epidemiol 146:214,1997
93.2 Men Women 100 75 54.0 42.1 40.3 Age-Adjusted Relative Risk 50 27.6 21.3 15.8 8.1 11.6 5.0 6.7 4.3 25 2.9 2.2 4.4 1.5 1.0 1.0 1.0 0 23–23.9 <22 <23 24–24.9 25–26.9 27–28.9 29–30.9 31–32.9 33–34.9 35+ Body Mass Index (kg/m2) Relationship Between BMI and Risk of Type 2 Diabetes Mellitus Chan J et al. Diabetes Care 1994;17:961. Colditz G et al. Ann Intern Med 1995;122:481.
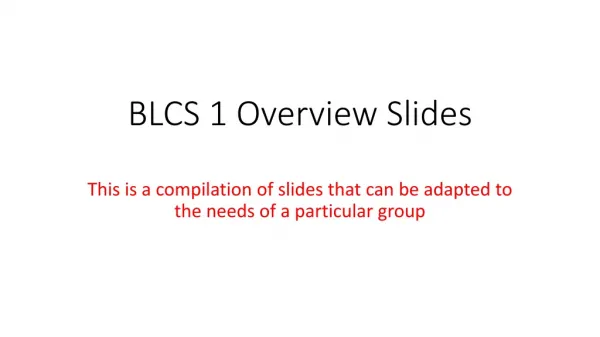
Obesity, Insulin Resistance, Metabolic Syndrome and the Natural History of Type 2 Diabetes Age 0-15 15-40+ 15-50+ 25-70+ Envir.+ Other Disease Genes Macrovascular Complications Disability Obesity (visceral) Poor Diet Inactivity IRS/Metabolic Syndrome ObesityHypertensionHDL,TG, Ins. Res.,HYPERINSULINEMIA Endothelial Dysfunction, AtherosclerosisPCO,ED Insulin Resistance MICVAAmp ppg>140 (7.8mM) DEATH IGT Type 2 DM -Cell Secretion BlindnessAmputationCRF EyeNerveKidney ETOHBPSmoking Risk of Complications Disability Microvascular Complications
Genes that Cause or are Associated with Diabetes Insulin Secretion Neonatal KCNJ11/Kir6.2 ABCC8/Sur1 Insulin MODY HNF-1α,1β, 4 α Glucokinase PDX1/IPF1 Neurod1/Beta2 KLF11 CEL Mitochondrial diabetes Type 2 CDKAL1 TCF7L2 HHEX/IDE SLC30A8/ZNT8 WFS1 NOTCH2-ADAM30 Insulin action Insulin receptor PPARG PHENOTYPE- eg: age of presentation, IFG/ IGT/Both/ severity depends on number of which kind of genes a person inherits – GENOTYPE Obesity FTO MCR4 Unknown IGFBP2 CDKN2A/B KIF11 JAZF1 CDC123-CAMK1D TSPAN8-LGR5 THADA ADAMTS9 NOTCH-ADAM30 Modified from McCarthy, NEJM 363:24,2339.
The Adipocytokine Syndrome: A New Model for Insulin Resistance and ß-Cell Dysfunction Atherothrombosis Liver Artery CRP, PAI-1 FFA, TNFa, IL-6 Angiotensinogen, PAI-1 FFA, TNFa Obesity IR Diabetes ASVD Adiponectin Adiponectin FFA Visceral fat cells Resistin, TNFa Leptin Sns FFA, TNFa, Leptin Muscle Brain Pancreas
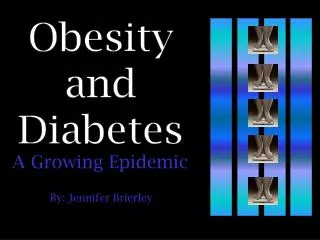
4% 25% 21% 75% 75% Age 4–10 y Age 11–18 y Impaired Glucose Tolerance is Highly Prevalent Among Obese Youth Normal GTT Impaired GTT Diabetes GTT: glucose tolerance test Sinha et al. N Engl J Med 2002;346:802.