Download
1 / 63
630 likes | 664 Views
Examining a grapefruit thrown in the air to find a linear function for its velocity over time. Calculating the rate of change of velocity and deriving the formula. Interpretation of slope and intercept in linear functions. Application in real-life scenarios like oxygen consumption and party expenses.

E N D
Section 1.4 Formulas for Linear Functions
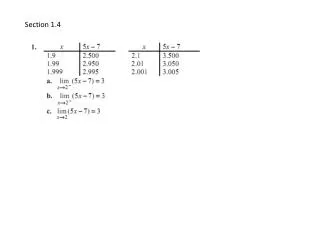
A grapefruit is thrown into the air. Its velocity, v, is a linear function of t, the time since it was thrown. (A positive velocity indicates the grapefruit is rising and a negative velocity indicates it is falling.) Check that the data in Table 1.30 corresponds to a linear function. Find a formula for v in terms of t. Page 27 Example 1
A grapefruit is thrown into the air. Its velocity, v, is a linear function of t, the time since it was thrown. (A positive velocity indicates the grapefruit is rising and a negative velocity indicates it is falling.) Check that the data in Table 1.30 corresponds to a linear function. Find a formula for v in terms of t. We will calculate: Rate of change of velocity with respect to time (or rate of change, for short). Page 27
Finding a Formula for a Linear Function from a Table of Data Page 27
Finding a Formula for a Linear Function from a Table of Data Page 27
Finding a Formula for a Linear Function from a Table of Data Page 27
Finding a Formula for a Linear Function from a Table of Data Page 27
Since v is a function of t, we have: v = f(t). We also remember from Section 1.3: m = ? Page 28
Since v is a function of t, we have: v = f(t). We also remember from Section 1.3: m = slope (or the rate of change = Δv/Δt) Here, m = ? Page 28
Since v is a function of t, we have: v = f(t). We also remember from Section 1.3: m = slope (or the rate of change = Δv/Δt) Here, m = -32. So we have: v = b + mt or v = b -32t Page 28
v = b -32t How do we solve for b? Page 28
What can we use from this chart? Page 28
Take any pair of values from the chart: (1, 48) or (2, 16) or (3,-16) or (4,-48) and ? Page 27
Take any pair of values from the chart: (1, 48) or (2, 16) or (3,-16) or (4,-48) and substitute into: v = b -32t Page 27
Take any pair of values from the chart: (1, 48) or (2, 16) or (3,-16) or (4,-48) and substitute into: v = b -32t (1,48): 48 = b - 32(1) → 48 + 32 = b → b = 80 Page 27
Take any pair of values from the chart: (1, 48) or (2, 16) or (3,-16) or (4,-32) and substitute into: v = b -32t (1,48): 48 = b - 32(1) → 48 + 32 = b → b = 80 (2,16): 16 = b - 32(2) → 16 + 64 = b → b = 80 Page 27
Take any pair of values from the chart: (1, 48) or (2, 16) or (3,-16) or (4,-32) and substitute into: v = b -32t (1,48): 48 = b - 32(1) → 48 + 32 = b → b = 80 (2,16): 16 = b - 32(2) → 16 + 64 = b → b = 80 (3,-16): -16 = b - 32(3) → -16 + 96 = b → b = 80 Page 27
Take any pair of values from the chart: (1, 48) or (2, 16) or (3,-16) or (4,-32) and substitute into: v = b -32t (1,48): 48 = b - 32(1) → 48 + 32 = b → b = 80 (2,16): 16 = b - 32(2) → 16 + 64 = b → b = 80 (3,-16): -16 = b - 32(3) → -16 + 96 = b → b = 80 (4,-48): -48 = b -32(4) → -48 + 128 = b → b = 80 Page 27
So what is our final equation? Page 28
So what is our final equation? v = 80 - 32t Page 28
v = 80 - 32t Note: m = -32 ft/sec per second (a.k.a. ft/sec2) implies: the grapefruit’s velocity is decreasing by 32 ft/sec for every second that goes by. “The grapefruit is accelerating at -32 ft/sec per second.” Negative acceleration is also called deceleration. (Note: no shorthand way of saying “ft/sec per second”.) Page 28
Finding a Formula for a Linear Function from a Graph We can calculate the slope, m, of a linear function using two points on its graph. Having found m, we can use either of the points to calculate b, the vertical intercept. Page 28
Figure 1.25 shows oxygen consumption as a function of heart rate for two people. (a) Assuming linearity, find formulas for these two functions. (b) Interpret the slope of each graph in terms of oxygen consumption. Page 28 Example 2
Let's calculate m: Page 29
Let's calculate m: Page 29
Let's calculate m: Page 29
What are our 2 linear equations so far? For person A: Page 29
What are our 2 linear equations so far? For person A: For person B: Page 29
Now let's calculate b: Page 29
Now let's calculate b: Page 29
Now let's calculate b: Page 29
What are our 2 linear equations? Page 29
What are our 2 linear equations? For person A: Page 29
What are our 2 linear equations? For person A: For person B: Page 29
Figure 1.25 shows oxygen consumption as a function of heart rate for two people. (b) Interpret the slope of each graph in terms of oxygen consumption. What about (b)? Page 29
Here are two reminders- this slide and the next: Page 29
m=.01 m=.0067 Page 28
Since the slope for person B is smaller than for person A, person B consumes less additional oxygen than person A. Page 29
We have $24 to spend on soda and chips for a party. A six-pack of soda costs $3 and a bag of chips costs $2. The number of six-packs we can afford, y, is a function of the number of bags of chips we decide to buy, x. (a) Find an equation relating x and y. (b) Graph the equation. Interpret the intercepts and the slope in the context of the party. Page 30 Example 3
Let: x = # of bags of chips y = # of six-packs of soda Page 30
Let: x = # of bags of chips $2x = amount spent on chips y = # of six-packs of soda Page 30
Let: x = # of bags of chips $2x = amount spent on chips y = # of six-packs of soda $3y = amount spent on soda Page 30
Let: x = # of bags of chips $2x = amount spent on chips y = # of six-packs of soda $3y = amount spent on soda & 2x + 3y = 24 Page 30
2x + 3y = 24 Let's solve for y: Page 30