
Patterns of T Cell Infiltration and Cancer Cell Destruction in Tumors
This study analyzes the infiltration of T cells and the destruction of cancer cells and vessels in tumor regions using immunohistochemistry and longitudinal imaging. The study also investigates the changes in myeloid populations and the effects of preconditioning irradiation on tumor-induced immunosuppression.

Patterns of T Cell Infiltration and Cancer Cell Destruction in Tumors
E N D
Presentation Transcript
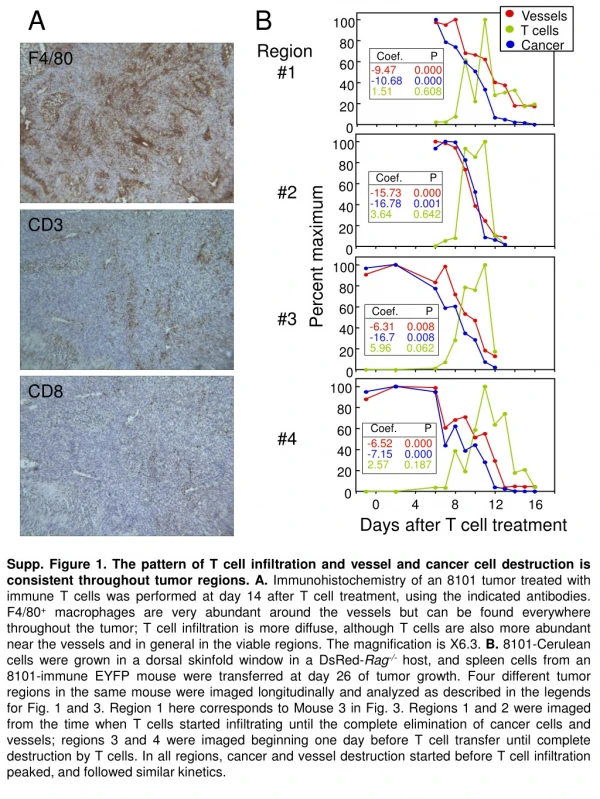
A B Vessels T cells 100 Cancer Coef. P -9.47 0.000 -10.68 0.000 1.51 0.608 80 60 40 20 0 100 Coef. P 80 -15.73 0.000 -16.78 0.001 3.64 0.642 60 40 20 0 100 80 60 40 Coef. P -6.52 0.000 -7.15 0.000 2.57 0.187 -6.31 0.008 -16.7 0.008 5.96 0.062 20 0 100 Coef. P 80 60 40 20 0 0 4 8 12 16 Region #1 F4/80 #2 CD3 Percent maximum #3 CD8 #4 Days after T cell treatment Supp. Figure 1. The pattern of T cell infiltration and vessel and cancer cell destruction is consistent throughout tumor regions.A. Immunohistochemistry of an 8101 tumor treated with immune T cells was performed at day 14 after T cell treatment, using the indicated antibodies. F4/80+ macrophages are very abundant around the vessels but can be found everywhere throughout the tumor; T cell infiltration is more diffuse, although T cells are also more abundant near the vessels and in general in the viable regions. The magnification is X6.3. B. 8101-Cerulean cells were grown in a dorsal skinfold window in a DsRed-Rag-/- host, and spleen cells from an 8101-immune EYFP mouse were transferred at day 26 of tumor growth. Four different tumor regions in the same mouse were imaged longitudinally and analyzed as described in the legends for Fig. 1 and 3. Region 1 here corresponds to Mouse 3 in Fig. 3. Regions 1 and 2 were imaged from the time when T cells started infiltrating until the complete elimination of cancer cells and vessels; regions 3 and 4 were imaged beginning one day before T cell transfer until complete destruction by T cells. In all regions, cancer and vessel destruction started before T cell infiltration peaked, and followed similar kinetics.
MHCII 8 12 Treated mouse Control mouse Neutrophils (CD11b+Ly6G+) Monocytes (CD11b+ Ly6Chi) Macrophages (CD11b+F4/80+Ly6C-) SSC FSC A CD11b+ Gated on: CD11b+ CD11b+ 3 Control Gr1 8 F4/80 % of Max. 8 5 Treated F4/80 12 Gr1 % of Max. MHCII 12 Ly6C Ly6C Ly6G Ly6C B Supp. Figure 2. Monocyte and macrophages in 8101 tumors stay at similar percentages but become smaller and more dense after treatment with immune T cells.A. Analysis of the myeloid subpopulations within established 8101 tumors treated or not with immune T cells was performed as in Fig. 4, with the addition of the Ly6C staining. The experiment shown here is representative of three with similar results. B. Monocytes and macrophages but not neutrophils from treated mice show a FACS scatter representative of smaller, denser cells (lower FSC and higher SSC).
450 rad+OT1(N=7) 450 rad (N=2) No treatment (N=1) 2 53 63 69 # Cells 4 5 35 # Cells A 2 1.5 1 Tumor volume (cm3) 0.5 0 0 140 10 20 30 40 50 Days after tumor inoculation B Myeloid cells Cancer cells Control 46 Treated Ly6G F4/80 DAPI Ly6C Ly6C Supp. Figure 3. Changes in B16OVA stroma after successful treatment with T cells.A. B6 mice bearing established B16OVA tumors (day 18-24) were treated with preconditioning irradiation (450 rad) followed or not by splenocytes from 1 naïve OT1 mouse 24 later. Data are pooled from two independent experiments. B. FACS Analysis of treated (450 rad + OT1 cells) and untreated B16OVA tumors. (Left) Staining with DAPI as a viability dye reveals a higher percentage of dead CD45- cancer cells in the treated mouse. (Right) The composition of the myeloid infitrate changes in the treated mouse: monocyte/macrophages (Ly6C+F4/80+) are less abundant among CD11b+ myeloid cells whereas neutrophils (Ly6C+Ly6G+) are enriched compared to the untreated tumor. CD11b+ are gated in viable (DAPI-) cells. A representative experiment is shown of three with similar results.
66 1.5 70 11 1.8 1.9 TBA irr. TBA control 0.3 None 40 cpm (x103) 2 20 1.5 1 0.5 0 0 1:4 1:1 1:2 No F4/80 F4/80:T 100 80 60 40 20 0 A PBL Spleen Tumor 62 Control 19 Ly6G F4/80 93 92 Irradiated (450 rad) 59 0.3 1 B Gr1 CD11b C Gr1lo cells (x103) per L blood Suppression of T cell proliferation (%) irr. non-irr. 8101-bearing Normal Supp. Figure 4. Preconditioning irradiation affects systemic but not local tumor-induced immunosuppression at the time of T cell transfer.A. FACS analysis of PBL, splenocytes and tumor infiltrating leukocytes showing the percentages of Gr1hi, Gr1lo, and TAM, in an 8101RE-tumor bearing B6C3F1 mouse 24 h after receiving 450 rad, the time when T cells are transferred in immunocompetent mice that are pre-treated with preconditioning irradiation (Ref. 38). A non-irradiated 8101RE-tumor-bearing Rag-/-mouse was stained in parallel as a control. B. Suppression of T cell proliferation by PBL from the blood of a 450 rad-treated 8101-bearing mouse or equivalent volumes of blood from two non-irradiated mice: one tumor-bearing and one tumor-free. The % inhibition of T cell proliferation was calculated with respect to the maximum proliferation of T cells observed in the absence of suppressor cells (17617 cpm). C. Suppression of T cell proliferation by equal numbers of purified tumor F4/80+ macrophages from irradiated vs. non-irradiated 8101-bearing mice, 24 h after irradiation.