Download
1 / 54
540 likes | 723 Views
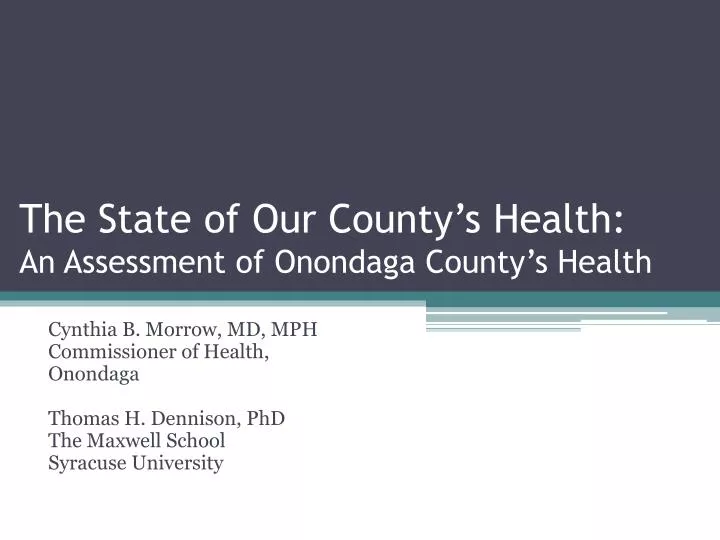
The State of Our County’s Health: An Assessment of Onondaga County’s Health. Cynthia B. Morrow, MD, MPH Commissioner of Health, Onondaga Thomas H. Dennison, PhD The Maxwell School Syracuse University. Overview.

E N D
The State of Our County’s Health: An Assessment of Onondaga County’s Health Cynthia B. Morrow, MD, MPH Commissioner of Health, Onondaga Thomas H. Dennison, PhD The Maxwell School Syracuse University
Overview • Why are we doing a Community Health Assessment (CHA) and what does it involve? • What do we know about the State of the County’s Health? • Where do we go from here? • How can you be involved?
Why are We Doing a CHA? • To support planning for programs to improve the health of our community, by government and the private sector; and • To address a set of regulations at the federal state and local levels. • Federal: Patient Protection and Affordable Care Act • State: New York State Prevention Agenda • Local: Accreditation of the County Health Department by the Public Health Accreditation Board (PHAB)
Patient Protection and Affordable Care Act • All Non-profit Hospitals must complete a Community Health Assessment and a Community Health Needs Assessment. • The process must be collaborative • The outcome must be a specific plan and budget to show how the hospital improves the health of the community • Sanctions are enforced through the Internal Revenue Service (fines and jeopardy of non-profit status).
New York State Prevention AgendaPriority Areas PreventChronic Diseases Promote a Healthy and Safe Environment Promote Healthy Mothers, Infants and Children Promote Mental Health and Prevent Substance Abuse Prevent HIV, STDs, Vaccine Preventable Disease and Healthcare Associated Infections
New York State Prevention AgendaPriority Areas • Health Department and Hospitals must choose two of the prevention agenda priority areas in common and • Develop strategies that will address those areas.
The Process to Date • Community Focus Groups • Discussions between the County Health Department and Hospitals • Data Collection and Analysis
What Does a Healthy Community Look Like? Healthy Sunshine A Healthy Environment with Clean Land, Water, and Air Policy and Education Considerations Availability and Access to Services Healthy Nutrition (grocery stores, restaurants, food pantries) Ample Hospitals, Clinics, Doctor Offices, and Elder Care Facilities Easy Point of Entry for Services Tree = Life, Importance of Being Collectively Human Importance of Past History
Health Status Health System Community Forum Findings – Top Issues • Obesity • Chronic Disease • Physical Activity • Nutrition • Tobacco and Other Drug Addictions • Cost of Healthcare • Affordability and Accessibility of Health Insurance • Aging Population and Elderly Care
The Demographics • Total population: 466,852 • 81.8% White • 11.4% Black • 3.2% Asian • 0.9% American Indian / Alaska Native • 2.6% Two or more races • 4.3% Hispanic (all races) Source: U.S. Bureau of the Census, Population Estimates Program, 2011
Onondaga County City of Syracuse Race Source: U.S. Bureau of the Census, Population Estimates Program, 2011
Syracuse vs. Onondaga County • The median household income for Onondaga County is more than $20,000 greater than the City of Syracuse. • In Syracuse, 32.3% of residents live below the poverty line. • Nearly 40% of Syracuse children live in poverty. • The high school graduation rate for SCSD ranges from 41% to 57%. • By comparison, HS graduation rates for suburban schools range from 95% (FM) to 65% (Lafayette). Sources: U.S. Census Bureau, ACS 5-year estimates (2007-2011) New York State Education Department (2008-2009 school year)
The Framework for Data Analysis:The Five Prevention Agenda Priorities • Prevent chronic disease • Promote a healthy and safe environment • Promote healthy women, infants, and children • Promote mental health and prevent substance abuse • Prevent HV,STD, VPD and health care associated infections
Prevent Chronic Disease • Areas of interest: • Heart disease • Cancer • Obesity
Sources: NYSDOH County Health Indicators, Cardiovascular Disease, http://www.health.ny.gov/statistics/chac/indicators/chr.htm Healthy People 2020http://www.healthypeople.gov/2020/topicsobjectives2020/objectiveslist.aspx?topicId=21 National Center for Health Statisticshttp://www.cdc.gov/nchs/fastats/deaths.htm
Leading Causes of Mortality in Onondaga County • In 2005, the leading cause of death in Onondaga County shifted from Diseases of the Heart Malignant Neoplasms. • Very few counties in NYS have made this shift. • Mortality from heart disease has been decreasing more quickly than mortality from cancer.
Incidence is Increasing, Mortality is Decreasing For Onondaga County Residents: >52 individuals are diagnosed with cancer each week >19 individuals die from cancer each week Source: http://www.acscan.org/ovc_images/file/action/states/ny/NY_Cancer_Burden_Report_2012.pdf Note: Rates are per 100,000, age-adjusted to the 2000 US Standard Population
Incidence Rates (2007-2009)Breast, Lung & Prostate Cancer Source: http://seer.cancer.gov/csr/1975_2009_pops09/browse_csr.php?section=36&page=sect_a_table.03.html NYSDOH County Health Assessment Indicators, Cancer, 2007-2009 http://www.health.ny.gov/statistics/chac/chai/docs/can_31.htm Note: Rates are per 100,000, age-adjusted to the 2000 US Standard Population
Mortality Rates (2007-2009)Breast, Lung & Prostate Cancer Source: http://seer.cancer.gov/csr/1975_2009_pops09/browse_csr.php?section=36&page=sect_a_table.03.html NYSDOH County Health Assessment Indicators, Cancer, 2007-2009 http://www.health.ny.gov/statistics/chac/chai/docs/can_31.htm Note: Rates are per 100,000, age-adjusted to the 2000 US Standard Population
Obesity* Rates in Children and Adults Source: Adults – NYSDOH Expanded BRFSS, 2008-2009, NHANES 2005-2008, Children / Adolescents – Student weight status category reporting system, 2010-2012, NHANES 2005-2008 http://www.health.ny.gov/prevention/prevention_agenda/2013-2017/indicators/2013/onondaga.htm *Obesity is defined as weight category ≥ 95th percentile among children and as BMI ≥ 30.0 among adults
Promote a Healthy and Safe Environment • Areas of interest: • Asthma • Shigellosis • Injury • Access to Healthy Foods
Promote a Healthy and Safe Environment Source: NYSDOH County Health Assessment Indicators, Respiratory Disease 2008-2010 http://www.health.ny.gov/statistics/chac/chai/docs/res_31.htm Healthy People 2020 Objectives: http://www.healthypeople.gov/2020/topicsobjectives2020/objectiveslist.aspx?topicId=21
Promote a Healthy and Safe Environment • Shigellosis outbreak beginning in June 2012 • 246 cases reported in 2012 compared to 4 cases in 2011 • 32 cases have been reported through March 2013 • Early clusters identified in child care settings
Promote a Healthy and Safe Environment Source: NYSDOH County Health Assessment Indicators, Injury, 2008-2010 http://www.health.ny.gov/statistics/chac/chai/docs/inj_31.htm
Homicide Death Rate, 2008-2010 (Age-adjusted per 100,000) Source: Health Indicators Warehouse via National Vital Statistics System – Mortality, 2008-2010: http://healthindicators.gov/Indicators/Homicide-deaths-per-100000_1041/Profile/Data
Access to healthy foods • In Onondaga County: • 6.3% of children have low access to a grocery store • 5.5% of low income residents have low access to a grocery store (NYS 2.5%) Community Commons 2.0 Starter Map, Community Health Needs Assessment Source: USDA Food Environment Atlas, 2010
Promote Healthy Women, Infants and Children • Infant mortality disparities • Breastfeeding rates • Teen births
Infant Mortality, 2010 – 2012* • Source: Statewide Perinatal Data System, OCHD Bureau of Surveillance and Statistics • *2011 and 2012 data are provisional
Breastfeeding rates, 2008-2010* Source: NYSDOH Community Health Assessment Indicators, Maternal and Infant Health: http://www.health.ny.gov/statistics/chac/chai/docs/mih_31.htm *Onondaga County rates are significantly different than NYS rates for each indicator shown
Teen Births per 1,000 females, 2008-2010* Source: NYSDOH Community Health Assessment Indicators, Family Planning/Natality: http://www.health.ny.gov/statistics/chac/chai/docs/fp_31.htm *Onondaga County rates are significantly different than NYS rates for each indicator shown
Teen Births per 1,000 females by select zip codes, 2008-2010 Source: NYS County/Zip Code Perinatal Data Profile, NYSDOH Bureau of Biometrics and Statistics http://www.health.ny.gov/statistics/chac/perinatal/county/onondaga.htm
Promote Mental Health and Prevent Substance Abuse • Areas of interest • Self-inflicted injury • Newborn drug-related hospitalizations
Self-inflicted injury, 2008-2010 Source: NYSDOH County Health Assessment Indicators, Injury, 2008-2010, http://www.health.ny.gov/statistics/chac/chai/docs/inj_31.htm
Newborn drug-related hospitalizations, 2008-2010 Source: NYSDOH County Health Indicators, Tobacco, Alcohol and other Substance Abuse Indicators, http://www.health.ny.gov/statistics/chac/chai/docs/sub_31.htm
Newborn drug-related hospitalizations: Local data review - 2012 • Laboratory data for mothers and infants with a positive drug screen were matched to the Electronic Birth Certificate for January – May, 2012. • Maternal risk factors include: • Medicaid paid birth • Black race • Fewer years of education completed • Younger age • Decreased paternal involvement • Increased self-reported use of illegal drugs, alcohol and tobacco during pregnancy Source: Siddiqui S, 2012 Statewide Perinatal Data System Laboratory Alliance of CNY
NICU Admission Rates, 2012 Source: Siddiqui S, 2012 Statewide Perinatal Data System Laboratory Alliance of CNY
Source: Siddiqui S, 2012 Statewide Perinatal Data System Laboratory Alliance of CNY
Births to women with self-reported illegal drug use during pregnancy, Syracuse and Onondaga County, 2007-2009 and 2010-2012* Source: Statewide Perinatal Data System, Onondaga County Bureau of Surveillance and Statistics
Prevent HIV, STD, VPD, and Health Care Associated Infections
Prevent HIV, STD, VPD, and Health Care Associated Infections • Areas of interest • Influenza • Gonorrhea
Influenza activity, 2012 - 2013 Source: NYSDOH Communicable Diseases Electronic Surveillance System (CDESS)
Gonorrhea rate per 100,000 population, Onondaga County 2010 - 2012 Source: NYSDOH Communicable Diseases Electronic Surveillance System (CDESS) U.S. Census Bureau, 2010 Census
Gonorrhea rates by age and sex, 2012 Source: NYSDOH Communicable Diseases Electronic Surveillance System (CDESS) U.S. Census Bureau, 2010 Census