Download
1 / 97
1k likes | 1.39k Views
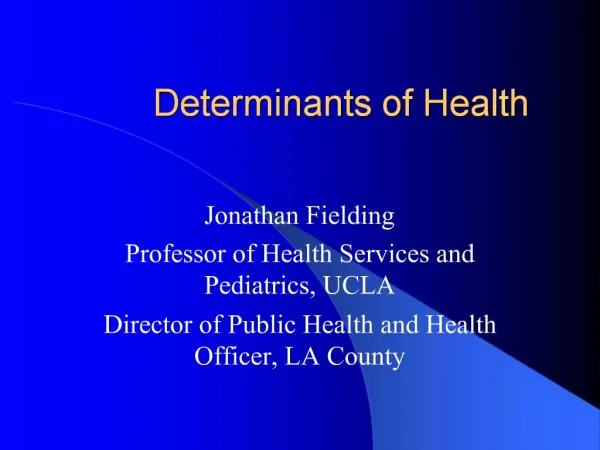
The Determinants of Health: Getting to the Root Causes. University of California, Los Angeles October 2, 2013. Jonathan E. Fielding, MD, MPH, MBA Director and Health Officer, Los Angeles County Department of Public Health Distinguished Professor of Health Services and Pediatrics

E N D
The Determinants of Health:Getting to the Root Causes University of California, Los Angeles October 2, 2013 Jonathan E. Fielding, MD, MPH, MBA Director and Health Officer, Los Angeles County Department of Public Health Distinguished Professor of Health Services and Pediatrics Schools of Public Health and Medicine, UCLA
Warm-Up Exercise Your health is determined by many factors. In the next 5 minutes allocate a total of 100 points to the factors you believe influence health. Example: X points – your diet/nutrition
One Model of Population Health Mortality (50%) Health Outcomes Morbidity (50%) Tobacco use Diet & exercise Health behaviors (30%) Alcohol use Unsafe sex Clinical care (20%) Access to care Quality of care Health Factors Education Employment Social & economic factors (40%) Income Family & social support Community safety Environmentalquality Physical environment (10%) Programs and Policies Builtenvironment County Health Rankings model © 2010 UWPHI
Los Angeles County • Most populous county in the nation • Larger population than 43 states • 26% of Californians live in LA County • Over 4,000 square miles • 88 incorporated cities • ≈140 unincorporated areas • 2 islands Sources: US Census Bureau, State and County QuickFacts - LA County (last rev 6-27-13); California Department of Transportation: LA County Profile (last rev 7-22-13)
Los Angeles County Residents • 9.9 million residents • 24% under 18 years old • 12% over 65 years old • 16% below poverty level • 36% foreign born • Over 140 cultures and 200 languages • 57% speak a language other than English at home • ≈1.7 million students in elementary and high school • Thousands attend 27 community colleges and universities • ≈ 73,000 residents are homeless Sources: 1) US Census Bureau, State and County QuickFacts - LA County (last rev 6-27-13); 2) Residents, County of Los Angeles, http://lacounty.gov/wps/portal/lac/residents;
Los Angeles County Residents, by Race/ Ethnicity, 2012 Source: US Census Bureau State & County QuickFacts: Los Angeles County, California http://quickfacts.census.gov/qfd/states/06/06037.html Accessed September 16, 2013
Leading Causes of Death & Premature Death, LA County, 2010 Los Angeles County Department of Public Health, Office of Health Assessment & Epidemiology. 56,538 total deaths and 430,926 years of life lost, excluding infants less than 1 year of age and persons of unknown age. **Death before age 75 years.
Leading Causes of Death by Race/Ethnicity, LA County, 2010 Los Angeles County Department of Public Health, Office of Health Assessment & Epidemiology; August 2013 *Total includes persons of other or unknown race/ethnicity.
Leading Causes of Premature Death by Race/Ethnicity, LA County, 2010 Los Angeles County Department of Public Health, Office of Health Assessment & Epidemiology; August 2013 *Total includes persons of other or unknown race/ethnicity.
Crude Death Rate for Infectious Diseases, US, 1900 - 2000 * Rate is per 100,000 MMWR, CDC, 1999 MMWR, CDC, 1999
Number of Tuberculosis Cases, LA County, 2000-2010 http://publichealth.lacounty.gov/tb/stats/stat2010/TEAMREPORT-CASERATES_2010.pdf
AIDS Cases, AIDS Deaths and Persons Living with AIDS, LA County, 1991-2011 1. Number of new cases diagnosed each year. 2. Number of deaths occurred each year among persons reported with AIDS. 3. Number of persons living with AIDS at the end of each calendar year. *Data are provisional for 2009-11 HIV Epidemiology, Division of HIV and STD Programs, Los Angeles County Department of Public Health. 2011 Annual HIV Surveillance Report, February 2012: 1-36.
2012 Estimated Number of Persons Living with HIV and AIDS in Los Angeles County Estimated 59,500 living with HIV (including AIDS) in LAC 12,800 1,200 1,600 43,900 (1) Estimate that 21.5% of HIV+ in LA County are unaware of their infection; modified from CDC estimate. (2) Of 4,853 notifications pending investigation, estimate half of 2,400 who have detectable VL or confirmatory test to be unduplicated cases. (3) Out of the 3,200 cases reported as code, half are thought to represent unduplicated cases. Source: LAC Division of HIV and STD Programs, reported as of 12/31/2011.
Chronic Diseases are the Leading Cause of Death in the US Chronic diseases are responsible for 7 out of every 10 deaths Four of the top five causes of death are chronic diseases 14 1) Centers for Disease Control and Prevention. Health, United States, 2007. Available at www.cdc.gov/nchs/data/hus/hus07.pdf#summary, and Chronic Disease Overview: www.cdc.gov/nccdphp/overview.htm; 2) Centers for Disease Control and Prevention. Deaths: Final Data for 2007. National Vital Statistics Reports, Vol 58, Number 19
Projected Rise in Cases of Seven of the Most Common Chronic Diseases, 2003-2023 15 Source: DeVol, R, Bedroussian, A, et al. An Unhealthy America: The Economic Burden of Chronic Disease. The Milken Institute. October 2007. Full report available at: www.chronicdiseaseimpact.com.
The Centers for Disease Control and Prevention (CDC) estimates up to… …could be prevented, if Americans were to do 3 things: Stop smoking Start eating healthy Get in shape 40% of cancer 80% of heart disease and stroke 80% of type 2 diabetes 16 Mensah G. Global and Domestic Health Priorities: Spotlight on Chronic Disease. National Business Group on Health Webinar. May 23, 2006. Available at:www.businessgrouphealth.org/opportunities/webinar052306chronicdiseases.pdf.
Healthy People 2020 Ecologic Model of HealthDeterminants of Health Interventions Outcomes • Behavioral • outcomes • Specific risk factors, • diseases, &conditions • Injuries • Well-being & health-related Quality of Life • Health equity • Policies • Programs • Information Assessment, Monitoring, Evaluation & Dissemination
Trends in Leading Causes of Death, LA County, 1995-2009 Rate (per 100,000) Age-adjusted to year 2000 U.S. standard populationSource: OHAE, LAC DPH
Life Expectancy at Birth by Sex and Race/Ethnicity, LA County, 2011 Sources: 2010 Linked Death Files, Los Angeles County Department of Public Health, Data Collection and Analysis (DCA) Unit. 2009 to 2010 Linked Birth Files, Los Angeles County Department of Public Health, Data Collection and Analysis (DCA) Unit.July 1, 2010 Population Estimates, prepared for County of Los Angeles, Internal Services Department, Social Services Systems Division, released 1/26/2013.
Coronary Heart Disease Mortality by Race/Ethnicity, LA County, 2001-2009 Age – Adjusted rate per 100,000 Los Angeles County Public Health, Office of Health Assessment & Epidemiology
Behavior as a Determinant of Health Healthy People 2020 Ecologic Model of Health
Trends in Adult Cigarette Consumption, US, 1900–2005 Annual adult per capita cigarette consumption and major smoking and health events Master Settlement Agreement; California first state to enact ban on smoking in bars First Surgeon General’s Report Broadcast ad ban End of WW II Number of cigarettes Nonsmokers’ rights movement begins Cigarette price drop Federal cigarette tax doubles 20 states have > $1 pack tax Great Depression Year Centers for Disease Control and Prevention. (1999). MMWR 48:986–993. Per-capita updates from U.S. Department of Agriculture, provided by the American Cancer Society.
Costly Toll Of Tobacco • Tobacco use is single most preventable cause of death, with 10 million annual deaths estimated by 2030. • 50,000 annual deaths in the US due to secondhand smoke exposure alone. • In LAC, an estimated 336,000 children are exposed to secondhand smoke at home • One million+ smokers in LAC. • Adult smoking prevalence was at 13.1% in 2011 • 1 out of every 7 deaths in LAC is caused by tobacco use (≈ 9,000 deaths)
Percent of Adults Who Smoke Cigarettes by Gender, LAC, 2002-2011 Los Angeles County Health Survey
Prevalence of Cigarette Smokingby Age, LA County, 2011 Percent Age Group Los Angeles County Health Survey
The Toll of Alcohol • 2,500 people in LA County die from alcohol-related causes each year • Roughly 78,000 years of potential life lost • Alcohol is associated with digestive diseases, neuropsychiatric conditions, cardiovascular disease, malignant neoplasms, pregnancy-related conditions, fetal alcohol syndrome, and high risk sex • Alcohol has been implicated in DUIs, falls, suicide, poisonings and occupational injuries • Excessive alcohol consumption costs LA County an estimated $10.8 billion annually Los Angeles County Department of Public Health. Facts & Figures: Alcohol in LA County, Oct 2010. and Reducing Alcohol-Related Harms in LA County: A Cities & Community Health Report, March 2011.
Percent of Adults who Reported Binge Drinking in the Past Month in LA County, 2002-2011 Binge drinking for males is drinking 5 or more drinks on one occasion at least one time in the past month. Binge drinking for females is drinking 4 or more drinks on one occasion at least one time in the past month. Source: LA County Health Survey
Percent of Adults who Reported Binge Drinking in the past month, by Gender in LA County, 2011 Binge drinking for males is drinking 5 or more drinks on one occasion at least one time in the past month. Binge drinking for females is drinking 4 or more drinks on one occasion at least one time in the past month. Source: LA County Health Survey
Drug Abuse in Los Angeles County • Over 60,000 residents were admitted to publicly funded treatment programs from 2009-2010 • Most frequently reported drugs for which treatment was received were: • marijuana/hashish (27%) • alcohol (26%) • methamphetamine (18%) • cocaine/crack (13%) Los Angeles County, Department of Public Health, Substance Abuse Prevention and Control. Fact Sheet: Drug Use and Misuse in Los Angeles County Sept 2010.
Drug Use Among LA County High School Students*, Grades 9-12 • *Youth Risk Behavior Surveillance 2009, Centers for Disease Control & Prevention • “Current use” is that which occurred in the 30 days prior to the survey Los Angeles County, Department of Public Health, Substance Abuse Prevention and Control. Fact Sheet: Drug Use and Misuse in Los Angeles County Sept 2010.
Opioid Prescriptions Filled by Fiscal Year, LA County, 2007-2012 Source: Department of Justice, California Prescription Monitoring Program/ Controlled Substance Utilization Review and Evaluation System (CURES) data.
Hospitalizations and Emergency Department (ED) Visits for Opioid Dependence/Abuse, LA County, 2005-2010 Source: Office of Statewide Health Planning and Development, Hospital Discharge and Emergency Department Visit Data. Prepared by LA County Department of Public Health, Injury and Violence Prevention Program.
Benefits of Physical Activity Increased life span and improved function Reduced hypertension, heart disease, and stroke Prevention of diabetes and related complications Decreased risk of colon cancer Improved mental health Body weight maintenance and obesity control Increased bone mass Improved immune function Reduced health care costs 33 Surgeon General’s Report, 1996
Physical Activity Guidelines for Americans (PAGA) Study 2011 study assessed self-reported vs. objectively measured physical activity among U.S. adults (n=4,773) using accelerometer data Percentage of adults meeting the PAGA: Self reported: 62% Objectively measured: 9.6% Tucker, J, et al. Physical Activity in U.S. Adults: Compliance with the Physical Activity Guidelines for Americans. AM J Prev Med 2011; 40(4): 454-461
Self Reported Levels of Physical Activity Among Adults in LA County, 2011 Makes you wonderhow many of these… are actually these? Los Angeles County Health Survey
Prevalence of Adult Obesity,LA County, 1997-2011 36 Los Angeles County Health SurveyDepartment of Public Health
Prevalence of Obesity & Diabetes Among Adults in LA County, 1997-2011 Los Angeles County Health SurveyDepartment of Public Health
Prevalence of Obesity Among 5th, 7th, and 9thGraders in LA County Public Schools, CA Physical Fitness Testing, 1999-2010 Healthy People 2010 Goal (<5%) Prevalence of Obesity Projected obesity prevalence assuming linear trend Source: California Physical Fitness Testing Program, California Department of Education. Includes 5th, 7th, and 9th graders enrolled in LA County public schools.
Obesity Prevalence Among 3 and 4 Year Olds in the WIC Program, LA County, 2003-2010 Source: PHFE WIC Program, LA County
Cities/Communities with Lowest and Highest Childhood Obesity Prevalence, 2008 *Table excludes cities/communities where number of students with BMI data < 500. Source: California Physical Fitness Testing Program, California Department of Education. Includes 5th, 7th, and 9th graders enrolled in LA County public schools; 2000 Census
Cost of Overweight, Obesity & Physical Inactivity - California, 2006 Billions Health Care $20.7 Lost Productivity $20.4 Total $41.2* Projected Cost for 2011: $52.7 BILLION *Figures may not add to total due to rounding The Economic Costs of Overweight, Obesity, and Physical Inactivity Among California Adults – 2006 (July 2009). The California Center for Public Health Advocacy.
Changes in Future Life Expectancies Related to Obesity and Diabetes Life expectancy has steadilyincreased over the past two centuries. Current rates of obesity projected to reduce life expectancy by .33 to .75 years over the next century. If rates of obesity and diabetes continue to increase at current rates, reductions in life expectancy may be to 2 to 5 years, or more 43 Olshansky et al NEJM March 17, 2005
Portion Control Campaign • "Choose Less, Weigh Less" • With bigger food portions come more calories, and consuming extra calories can lead to obesity, diabetes, heart disease and some cancers. • Campaign includes advertising on transit shelters, buses, rail cars, billboards, television, radio and online. Videos of portion size PSAs can be found at: http://www.youtube.com/playlist?list=UUJLnJaiTK2jnRhYWyCp865g&feature=plcp
Rethink Your Drink Campaign • Sugar sweetened beverages (SSB) are the largest single source of added sugar and calories in the American diet. • On average, nearly 39% of adults in LA County drink at least one SSB per day. • > 43% of children 17 or younger consume at least one SSB on an average day. • A child’s risk for obesity increases an average of 60% with every additional daily serving of soda.
Different Approaches to Addressing Overweight/Obesity: Personal Eating Behavior • Share meals • Partially fill beveragecontainers • Avoid ‘supersizing’ • Ask for reduced portion options • Compare nutritional values of your choices on labeled menus
Different Approaches to Addressing Overweight/Obesity: Eating Outside the Home • Promote healthy eating in workplaces and schools • Remove sweetened beverages and junk food from vending machines (schools, public agencies, businesses) • Create incentives for restaurants and cafeterias that offer healthy food items • Schools can promote participation in the School Breakfast Program and reduce high calorie snack opportunities in the classroom (e.g. birthday treats)
Strategies for Improving the Physical Environment for Nutrition Source: Public Health Institute
Physical and Social Environmentsas Determinants of Health Healthy People 2020 Ecologic Model of Health