Download
1 / 29
290 likes | 413 Views
This study examines the strategic integration of prairie strips within corn and soybean agricultural systems to enhance ecosystem services, particularly water quality. Conducted across 12 experimental watersheds in Iowa, findings indicate substantial reductions in sediment, phosphorus, and nitrogen runoff thanks to these prairie filter strips. The research supports the hypothesis that incorporating small amounts of perennial cover can yield significant biophysical and socioeconomic benefits. This work is supported by various agricultural and environmental organizations, highlighting its importance for sustainable farming practices.

E N D
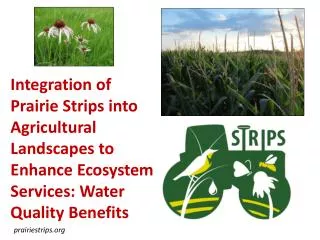
Integration of Prairie Strips into Agricultural Landscapes to Enhance Ecosystem Services: Water Quality Benefits prairiestrips.org
Funding • Leopold Center for Sustainable Agriculture • Iowa Department of Agriculture and Land Stewardship, Division of Soil Conservation • U.S. Forest Service Northern Research Station • Iowa State University College of Agriculture and Life Sciences • USDA-NCR-SARE • USDA-NIFA-AFRI-Managed Ecosystems • University of Iowa
Evaluation of Ecosystems Services in Mixed Annual-Perennial Agroecosystems • Hypothesis: Strategic placement of small amounts of perennial cover within agriculturally-dominated landscapes will have disproportionate benefits on biophysical and socioeconomic systems • To address this hypothesis we have four components: • Ecohydrology • Biodiversity • Socioeconomic • Educational and Extension
Experimental Watershed Treatments 12 watersheds: Balanced Incomplete Block Design: 3 reps X 4 treatments X 3 blocks 10% 10% 0% 20% corn - soybean row crops, ZERO TILLAGE reconstructed prairie
STRIPS: Science-based Trials of Row-crops Integrated with PrairiesNeal Smith National Wildlife Refuge, Prairie City, IA12 experimental watersheds, 0.5 to 3.2 ha each, 6 to 10% slope Four treatments: 100% crop (no-till) 10% buffer, at toe slope 10% buffer, in contour strips 20% buffer, in contour strips
Site History • Watersheds under primarily bromegrass cover until fall 2006 • Watershed instrumentation: spring 2005 • Pre-treatment data collection: 2005 – 2006 field seasons • Treatment establishment: fall 2006 & spring 2007 • Soybean planted in 2007 • Prairie strips sown in July 2007 • No-till corn-soybean rotation in cropped areas
Watershed Characteristics *Percent of grass filters = area of filters / area of watershed
Surface Runoff Monitoring H-flumes monitor movement of water, sediment, and nutrients
Surface Runoff Helmers et al., 2012
Sediment Loss in Runoff (2007-2011) >95% Reduction in sediment export from watersheds with prairie filter strips Helmers et al., 2012
Phosphorus Loss in Runoff (2007-2011) >90% Reduction in TP export from watersheds with prairie filter strips Helmers et al., in press
Total Nitrogen Loss in Runoff (2007-2011) >90% Reduction in TN export from watersheds with prairie filter strips Helmers et al., in press
Nitrate-N Loss in Runoff (2007-2011) Helmers et al., in press
Nitrate-N Concentrations in Groundwater NO3-N concentrations in shallow groundwater at (a) upslope and (b) toeslope positions. Error bars denote the standard deviation of the replicates. Statistical difference of mean nitrate concentration between treatments (grass filters vs. cropland) was indicated for each monitoring period using two significant levels (** p < 0.05, * p < 0.1).
Visual Examples (4 inch rain in June 2008) 10% Prairie 90% Crop 100% Crop 100% Prairie
Integrating prairie into crop fields can blur the lines between production and conservation lands… Photo: A. MacDonald
Matt Helmers Associate Professor Ag and BiosystemsEng. Iowa State University (515)-294-6717 mhelmers@iastate.edu prairiestrips.org
Vegetation in strips, 2008-2011 Plant diversity in the strips is increasing, especially for native perennial species. Time effects: p<0.0001 for each response. Hirsh et al., 2013
Cover by dominant species in strips, 2011 • Kentucky and Canada bluegrass, Poapratensis/compresa, 25.1% • Canada goldenrod, Solidagocanadensis, 11.6% • Gray-headed coneflower, Ratibidapinnata, 6.5% • Queen Anne’s lace, Daucuscarota, 6.4% • Indiangrass, Sorghastrumnutans, 5.6% • Wild bergamot, Monardafistulosa, 4.5% • Big bluestem, Andropogongerardii, 4.3% • Smooth brome, Bromusinermis, 4.0% • Hairy aster, Aster pilosus, 3.7% • Reed canary grass, Phalarisarundinacea, 3.1% • Ox-eye, Heliopsishelianthoides, 3.1% (native perennials) Hirsh et al., 2013
52 species overall 11species nesting A. MacDonald
Total Bird Abundance (TBA) Range = 0-33 individuals Mean = 5 A. MacDonald, unpublished data
Species Richness Range = 0-14 Species Mean = 2.6 A. MacDonald, unpublished data
Mean percent cover by non-crop species (‘weeds’) in cropped areas, 2009-2011 No significant differences in weed cover among all-crop and diversified watersheds Hirsh et al., 2013
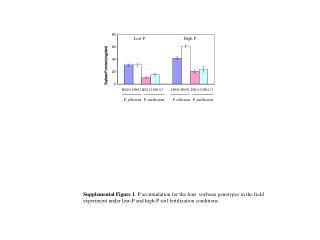
Corn and soybean yields from cropped areas of the catchments were unaffected by the presence or absence of prairie strips. Soybean strips vs. all crop: p=0.95 Corn Strips vs. all crop: p=0.46 All crop 10% bottom 20% contour All crop 10% contour 10% bottom 20% contour 10% contour M. Maier, unpublished data
Average Cost of Strips to Farmers Site prep & planting costs… ≤ 10% of total cost Cost calculation assumption: One acre of prairie “treats” the run-off from about 9 acres of row crops + ~ 10% - 15% of total cost Management costs… + Upwards of ~ 90% total cost 1. 4% discount rate; 15-year management horizon; average Iowa land rent charge. 2. Assumes 1 ac of prairie treats about 9 ac of row crops 3. Represents treated acre costs to farmer after CRP Opportunity Cost of land = foregone rent or revenue Keep in mind that cost scale with opportunity costs
Matthew J. Helmers1, Lisa Schulte-Moore2, J. Arbuckle3, Pauline Drobney4, Mary Harris2, Randall K. Kolka5, Matt Liebman6, Matt O'Neal7and John Tyndall2 (1) Ag & Biosystems Engineering, Iowa State University, Ames, IA(2) Natural Resource Ecology & Management, Iowa State University, Ames, IA(3) Sociology, Iowa State University, Ames, IA(4) U.S. Fish and Wildlife Service, Prairie City, IA (5) USDA Forest Service (FS), Grand Rapids, MN (6) Agronomy, Iowa State University, Ames, IA (7) Entomology, Iowa State University, Ames, IA prairiestrips.org
Conclusions • Strategic placement of prairie: • Reduced sediment and nutrient loss • Increased vegetation diversity • Increased bird abundance • Did not impact weed pressure • Did not impact yield (on a per unit area basis) • Is a cost effective strategy compared to other conservation practices