Download
1 / 62
650 likes | 1.01k Views
B. D. ADHIKARY , P. Majumdar and M. Kostic Department of Mechanical Engineering NORTHERN ILLINOIS UNIVERSITY. CFD Simulation of Open Channel Flooding Flows and Scouring Around Bridge Structures.

E N D
B. D. ADHIKARY , P. Majumdarand M. Kostic Department of Mechanical Engineering NORTHERN ILLINOIS UNIVERSITY CFD Simulation of Open Channel Flooding Flowsand Scouring Around Bridge Structures The 6th WSEAS International Conference on FLUID MECHANICS (WSEAS - FLUIDS'09)Ningbo, China, January 10-12, 2009 www.kostic.niu.edu
Overview • INTRODUCTION • LITERATURE REVIEW • OBJECTIVE • PROBLEM DEFINITION • COMPUTATIONAL MODEL • VALIDATION OF FORCE COEFFICIENTS • SCOUR PHENOMENON • DESCRIPTION OF SCOUR METHODOLOGY • DETERMINATION OF EQUILIBRIUM SCOUR • EFFECT OF SCOURING ON FORCE COEFFICIENTS • CONCLUSIONS & RECOMMENDATIONS
INTRODUCTION • Bridge failure analysis is important from CFD perspective • Most of the bridge fails due to flood in an open channel • Under flooding conditions, force around the bridge becomes very high • High stresses caused at the channel bed results in scour • Design and analysis software shows a way to design a cost-effective and quality bridge structure • Experimental results throw the challenge to have solution for the real-life problem
Scour hole Failed bridge Piers Fig 1: Bridge failure
OBJECTIVE • Calculation of force coefficients around the bridge under various flooding conditions • Identification of proper turbulence model and modeling option • Analysis of turbulence effects on the bridge • Comparison of force coefficients with experimental results • Study of pressure scour development • Development of a methodology to analyze pressure scour • Comparison of computational scour depth with experiment • Effect of scouring on force coefficients
LITERATURE REVIEW Literatures related to numerical methods and modeling techniques of open channel flow: • Ramamurthy et al. analyzed the pressure and velocity distributions for an open channel flow using 2-D, Standard k-e Turbulence Model. • Koshizuka et al. simulated the free surface of a collapsing liquid column for an incompressible viscous flow using VOF technique and found good agreement between simulation and experimental results.
LITERATURE REVIEW Literatures related to pressure scour analysis: • Guo et al. projected an analytical model for partially and fully submerged flows around the bridge based on a critical shear stress correlation which showed good agreement with the experimental results. • Benoit et al. proposed a new relationship between the roughness height and the main hydrodynamic and sediment parameters for plane beds, under steady operating conditions.
PROBLEM DEFINITION • Need to find out a computational model and modeling technique for turbulence and force analysis around the bridge using STAR-CD CFD software. Fig 2: Characteristic dimensions for the channel and the bridge Fig 3: Detail bridge dimension
DIMENSIONLESS PARAMETERS Reynolds Number: Froude Number: Inundation Ratio: Drag Force Coefficient: Lift Force Coefficient:
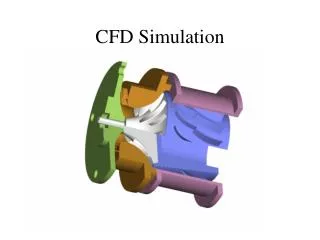
COMPUTATIONAL MODEL • Two computational model are used. • Free-Surface or VOF Model • Single-Phase Flat-Top Model Governing Equations:
Where For Laminar Flow For Turbulent Flow Additional Transport Equation for VOF: Where
‘VOF’ MODEL Fig 4: Computational Domain for VOF Model Fig 5: Mesh Structure for VOF Model
BOUNDARY CONDITIONS SLIP WALL AIR INLET OUTLET WATER INLET NO SLIP WALL SYMPLANE Fig 6: Boundary conditions for VOF Model • Air & Water Inlet: Velocity inlet having 0.35 m/s free-stream velocity • Outlet: Constant pressure gradient at boundary surface • Bottom Wall: Hydro-dynamically smooth no-slip wall
‘VOF’ SIMULATION PARAMETERS Computation time 200 sec
TURBULENCE MODELS USED • Two-Equation Models • k-e High Reynolds • k-e Low Reynolds • k-e Chen • k-e Standard Quadratic High Reynolds • k-e Suga Quadratic High Reynolds • Reynolds Stress Models • RSM/Gibson-Launder (Standard) • RSM/Gibson-Launder (Craft) • RSM/Speziale, Sarkar and Gatski
STEADY-STATE DEVELOPMENT t = 10 sec t = 50 sec t = 90 sec t = 100 sec t = 120 sec t = 150 sec t = 190 sec t = 200 sec Fig 7: Steady-state development of k-e Low-Re VOF Model
PARAMETRIC EFFECT ON FORCE COEFFICIENTS Temporal Effect: Drag Coefficient Lift Coefficient Fig 8
Effect of Slip & Symmetry BC at the Flat-Top: Drag Coefficient Lift Coefficient Fig 9
Effect of Bridge Opening: Drag Coefficient Fig 10
FORCE COEFFICIENT COMPARISON OF k-e MODELS Drag Coefficient Lift Coefficient Fig 11
FORCE COEFFICIENT COMPARISON OF RSM MODELS Drag Coefficient Lift Coefficient Fig 12
Comparison of force coefficients for different turbulence models:
SLIP WALL WATER INLET OUTLET SYMPLANE NO SLIP WALL SINGLE-PHASE MODEL Fig 15: Mesh structure of Single-phase Model Fig 16: Boundary conditions of Single-Phase Model
TURBULENCE MODELS USED • Two-Equation Models • k-e High Reynolds • k-e Low Reynolds • k-w Standard High Reynolds • k-w SST High Reynolds
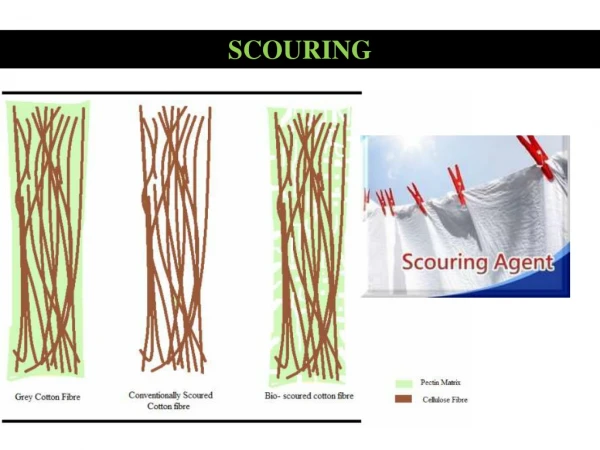
SCOUR PHENOMENON Caused by high stress at the river bed • Types of Scour: • Aggradation or Degradation Scour • Contraction Scour • Lateral Contraction • Longitudinal Contraction causes • pressure scour • Local Scour
SCOUR MODELING OPTIONS • A theoretical model proposed by Guo employing semi-analytical solution for flow-hydrodynamics. • Considering a two-phase flow and using VOF methodology, scour modeling has been done by Heather D. Smith in Flow-3D. • Eulerian two-phase model with coupled governing equations for fluid and solid sediment transport
In STAR-CD, VOF methodology found to be slow, numerically unstable and very sensitive towards Computational parameters. Eulerian two-phase model is also very complex in Terms of considering sediment transportation, Suspension and settlement. Single-phase model has been chosen for initial scour depth (ys) analysis.
SCOUR METHODOLOGY Scour methodology using a single-phase model has been developed based on the critical shear stress Formula proposed by Guo, known as Rouse-Shields equation. Where
OTHER CRITICAL SHEAR STRESS FORMULAE Based on Shields Coefficient: USWES Formula: Sakai Formula: Etc…..
CRITICAL SHEAR STRESS CURVE Fig 19: Variation of tc with diameter based on different formulae For mean diameter of 1 mm, tc varies from 0.43 Pa to 0.72 Pa, based on different formula.
VAN RIJN FORMULA Where, = Bed load transport rate = Bed Shear Stress = Critical Shear Stress
Fig 20: Model geometry Computational parameters:
After 19th iteration, final ys of 2.4 cm is obtained. Fig 21: Final scoured model Fig 22: Shear stress distribution
SCOUR AUTOMATION PROCESS Fig 23
Automation has been implemented for same geometry Mentioned in Fig. 19. Fig 24 After 24th iteration, final ys of 1.2 cm is obtained. Fig 25
Fig 26: Final scour shape After 20th iteration, final ys of 0.95 cm is obtained. Fig 27
EFFECT OF ROUGHNESS Bed shear stress depends on roughness. Roughness Formulae: Formula by Wilson: Formula by Yalin: Formula by Bayram et al. Based on these different formulae roughness (ks) varies from 0.195 mm to 2.5 mm for d50 = 1 mm.
VERIFICATION OF GUO’S PROFILE Guo proposed, For For
Fig 29: Without using 0.055 factor Fig 30: Using 0.055 factor
NEW SCOUR SCHEME In order to improve this scheme, the cell removal scheme is modified based on the magnitude of the deviation of computed shear stress from the critical shear stress. Below is the empirical formula for this.
INITIAL BED PROFILE Fig 31: Model geometry Fig 32
ITERATION # 02 Fig 33 Fig 34