Download

1 / 55
550 likes | 690 Views
Measurement of the angle g of the Unitarity Triangle: Status and prospects. Matteo Rama Laboratori Nazionali di Frascati Representing the BABAR Collaboration. The weak interactions of quarks.

E N D
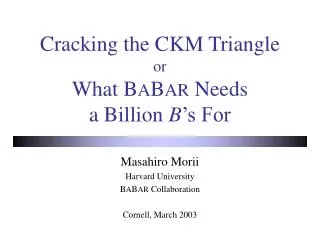
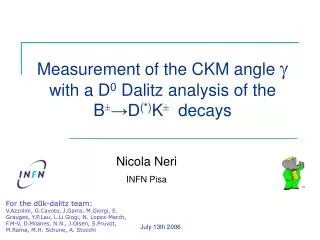
Measurement of the angle g of the Unitarity Triangle:Status and prospects Matteo RamaLaboratori Nazionali di Frascati Representing the BABAR Collaboration
The weak interactions of quarks • The electroweak coupling strength of the W± to quarks is described by the elements of the Cabibbo-Kobayashi-Maskawa matrix in the Standard Model (SM) • 3x3 unitary matrix ==> 4 parameters (after ad hoc choice of quark field phases) relative magnitude of the elements (exp) Measurement of g: Status and Prospects
CP the phase changes sign in the CP-conjugated process The Cabibbo-Kobayashi-Maskawa Matrix • An irremovable complex phase in VCKM is the origin of CP violation in the SM • In the Wolfenstein parameterization: Measurement of g: Status and Prospects
The Unitarity Triangle • V is unitary: VV+=1 ===> in the complex plane g=f3 Measurement of g: Status and Prospects
The BaBar Detector Electromagnetic Calorimeter 6580 CsI crystals e+ ID, π0 and γ reco Instrumented Flux Return 12-18 layers of RPC/LST μ ID e+ [3.1 GeV] Cherenkov Detector 144 quartz bars K, π, p separation Drift Chamber 40 layers tracking + dE/dx e- [9 GeV] Silicon Vertex Tracker 5 layers (double-sided Si sensors) vertexing + tracking (+ dE/dx) 1.5T Magnet Measurement of g: Status and Prospects
Pion/Kaon Discrimination: the DIRC LAYOUT Cherenkov angle vs. momentum for pions and kaons >4sseparation at 3 GeV/c Measurement of g: Status and Prospects
Key Analysis Techniques Exploit kinematics of e+e-(4S) BBfor signal selection • Event topology Signal Signal (spherical) Background Background (jet-structure) Measurement of g: Status and Prospects
Extraction of g with BD0K • D0/D0 decay to common final state • The interference depends on Vub and therefore on g • Critical parameter: ratio of amplitudes: • Select the D0 decays that enhance the interference: • 3-body (e.g. KSpp): Dalitz • CP-eigen. (e.g. KSp0): GLW • DCS (e.g. D0K+p-): ADS color allowed f + Vub f color suppressed Measurement of g: Status and Prospects
The Dalitz Method Measurement of g: Status and Prospects
The Dalitz Method (D0KSp+p-) Atwood et al., PRL78, 3257 (1997) Giri et al., PRD68,054018 (2003) • dB is strong phase diff. of A(B-D0K-) and A(B- D0K-) • AD(m-2,m+2) is the D0KSpp amplitude, determined from control sample • Unknowns: rB, dB and g + Measurement of g: Status and Prospects
The ‘Cartesian coordinates’ • Goal: Fit the Dalitz plot distributions of D0KSpp from B- and B+ decays to extract rB, dB and g • Complication: The Maximum Likelihood fit overestimates rB and underestimates the error of g • Solution: Write the Likelihood as a function of the cartesian coordinates x±, y±: Likelihood is Gaussian and unbiased in x±, y± • Strategy: Extract x±, y± from ML fit to the D0KSppDalitz plot and derive rB, dB and g from x±, y± with stat. procedure Measurement of g: Status and Prospects
K*(892) r (770) K* DCS The Dalitz Model of D0KSp+p- • From sample of 390k D0Kspp (purity 98%) • Isobar Model: 16 Breit-Wigner + constant term • Parameters from PDG/other experiments (except for s and s’, fitted from data) • 8 alternative models to estimate the total systematic associated to the model (including K-matrix to evaluate the pp S-wave ) Measurement of g: Status and Prospects
Sensitivity to gamma over the Dalitz plot • Sensitivity varies strongly over Dalitz plane • 2nd derivative of the log(L) event-by-event weighs the event rB=0.12 g=70° dB=180° Measurement of g: Status and Prospects
347 106 BB 227 106 BB Extraction of Signal B- D0K- • Selection of BD0K, BD*0K(D*0D0p0/g), BD0K* 39823 B- D*0[D0p0]K- B- D*0[D0g]K- B- D0K*- 9713 9312 428 Measurement of g: Status and Prospects
Measurement of x,y DKSpp Dalitz plot distribution in signal region (x±,y±) are extracted from the D0KSpp Dalitz plot B-D0K- B+D0K+ Note: (x±,y±) of D0K, D*0K and D0K* are different because (rB,dB) are different BD0K* B- BD*0K BD0K B- B+ B- d B+ rB+ B- B+ B+ rB- 2g Measurement of g: Status and Prospects
BaBar B-D0K- Main systematic errors Example: BD0K • <fill> syst. (no Dalitz) all the x,y results in the backup slides syst. Dalitz model the stat. error is dominant Measurement of g: Status and Prospects
227 106 BB 347 106 BB 347 106 BB (Dalitz) (stat) (syst) From x,y to g Used frequentist method to extract g, rB,dB from (x±,y±) D0K D*0K D0K* (alone) g (deg) g (deg) 2 s 1 s rb rb* (5dim confidence intervals projections) (3dim confidence intervals projections) 1s (2s) hep-ex/0607104 hep-ex/0507101 Doesn’t include D0K* Measurement of g: Status and Prospects
Comparison with Belle and role of rB • better precision of BaBar (x,y) does NOT translate to a smaller error on g. Why? [plots do not include Dalitz model errors] BaBar: [D0K* not included] Belle: Measurement of g: Status and Prospects
Dependence of Dg on the measured rB y Dg ~ 1/rB Dx ≈ Dy ≈ rBDq B- (x-,y-) the error of g is ~ proportional to the uncertainty of (x,y)’s and inversely proportianal to the distance from (0,0). Belle measurement is consistent with larger rB. rB Dq 2g x Dq rB (x+,y+) B+ Measurement of g: Status and Prospects
Future prospects • With 2ab-1 (~BaBar+Belle at the end of 2008), we expect: • 2300 BD0K; 900 BD*0K; 450 BD0K* • s(x,y)=0.030 (BD0K), 0.046 (BD*0K), 0.100 (BD0K*) • Difficult to predict the uncertainty on g because the relative error on rb(*) is still large • Scen1: rb(DK)=0.072; rb(D*K)=0.064; rb(DK*)=0.15: s(g)~13o • Scen 2: rb(DK)=0.098; rb(D*K)=0.104; rb(DK*)=0.24: s(g)~ 9o • Scen 3: rb(DK)=0.046; rb(D*K)=0.024; rb(DK*)=0.06: s(g)~25o • Dalitz model systematics ~10o today. It’s unlikely it will ever go below ~5o using flavor-tagged D0’s. Though it may not have a major impact at the B-factories… • … it will certainly limit this measurement at the next generations of experiments! (LHCb, superB) • model independent analysis re-check numbers Measurement of g: Status and Prospects
Model Independent Analysis [Giri, Grossman, Soffer, Zupan, PRD 68, 054018 (2003)] -i • divide the DKspp Dalitz plot in 2k bins (symmetric with respect to the m+2 vs. m-2 axis.) • express the B±DK± yields in each bin in terms of rb,g,db and a total of 2k unknowns ci,si • 4k equations with 2k+3 unknowns, solvable for k≥2 in principle i for example in bin i and –i (see figure): x±,y± usual cartesian coordinates is measured with flavor tagged D0Ksppdata Measurement of g: Status and Prospects
Model Independent Analysis • As a matter of fact, the 4k equations system with 2k+3 unknowns (prev. slide) requires additional input to be solvable (even at LHCb or at a SuperB). • Need to measure ci from CP-tagged D0Kspp to reduce the error. • If the bin size can be chosen small enough (it depends on the BDK signal yield) it’s possible to constrain also si with • preliminary studies:dg ~ 8o with 5000 BDK events (rB=0.1) • CLEO-c data probably not enough for LHCb precision Need BES-III data (beam collisions expected in 2007) @ CLEO-c Y(3770)DDDCPD(KSpp) hep-ph/0510246 and CKM2006 WG5 session (but it implies a sufficent number of CP-tagged D) Measurement of g: Status and Prospects
s(g) g with Model-Independent Analysis finalize Bondar and Poluetkov, hep-ph/0510246 Measurement of g: Status and Prospects
The Method GLW Measurement of g: Status and Prospects
The Classic Observables selected BD0K, BD*0K, BD0K* CP even: D0K+K-,p+p- CP odd : D0KSp0, KSw, KSf CP eigens. 4 observables: RCP+, ACP+, RCP-, ACP- CP eigens. g RCP±, ACP± not independent: RCP+ACP+ + RCP-ACP- = 0 g Measurement of g: Status and Prospects
A Useful Alternative Dalitz • RCP+, ACP+, RCP-, ACP- can be combined to: • Since the rB2 constraint of GLW is very weak, GLW alone can hardly constrain gamma. But it helps when joined to Dalitz. • The comparison with the Dalitz method is now straightforward: GLW Dalitz: x+, y+, x-, y- GLW: x+, x-, rB2 Constraint (weak) of rb2 not drawn Measurement of g: Status and Prospects
B±D0K± N(DK)=1260±40 232 106 BB B±D0CP+K± N(DK)=131±17 B±D0CP-K± N(DK)=148±17 Signal Extraction PRD73 (2006) 051105 • Yields are extracted with ML fit on DE and the Cherenkov angle • RCP± are measured as RCP±~ R±/R(Some systematic errors cancel in the ratio) • most dangerous background sources: • charmless BKpp/KKK for D0pp/KK • interference with D0Ks(KK)non-f and Ks(ppp0)non-w for D0Ksf and Ksw BD0K BD0p continuum+BBbar bkg Measurement of g: Status and Prospects
Summary of GLW Results BD0K BD*0K BD0K* BaBar: Belle: Phys.Rev. D73 (2006) 051105 Phys.Rev. D71 (2005) 031102 Phys.Rev. D72 (2005) 071103 Phys.Rev. D73 (2006) 051106 Measurement of g: Status and Prospects
Impact of GLW and Future Prospects • Projection of errors, for various assumptions on the values of rb, at the end of 2008 (BaBar + Belle). Dalitz (2ab-1) Dalitz+GLW (2ab-1) 13o 11o 9o 7.6o 25o 20o 1) numbers to be re-checked 2) 3) • Current central values for rb (D0K + D*0K + D0K*) • Current central values enhanced by 1s • Current central values diminished by 1s Measurement of g: Status and Prospects
The Method ADS Measurement of g: Status and Prospects
g g = (0.060±0.002)% Double Cabibbo Suppressed Decays • Cons: very small BF (no signal observed yet) • Pros: large bu vs. bc interference K+p-, K+p-p0,… K+p-, K+p-p0,… D0Kp: S=sin(dB+dD) C=cos(dB+dD) dD=strong phase diff. of D0/D0K+p- Measurement of g: Status and Prospects
232 106 BB D0Kp Selected BD0K, BD*0K, BD0K*. Below BD0K D0K-p+ D0K+p- 1) / 3) 2) From RADS to rB RADS<0.029 @90%CL (usingrD=0.060±0.002) no evidence of signal set upper limit on RADS rB<0.23 @90% CL Measurement of g: Status and Prospects
=(0.214±0.011)% = point in Dalitz Plot g = strong phases of Df and Df D0K+p-p0 • Compared to D0K+p-: 3-body decay, larger BF, more background, smaller rD • If signal were abundant then a Dalitz analysis as the D0KSpp could be done. BUT signal is very small (actually consistent with zero) ADS analysis: |C|≤1 Measurement of g: Status and Prospects
226 106 BB rB<0.185 (95% C.L.) D0K+p-p0 Results • BD0K selected with ML fit to DE, mES and neural network with event shape info hep-ex/0607065 D0K-p+p0 preliminary preliminary RADS<0.039 (95% C.L.) D0K+p-p0 DE(GeV) Likelihood of rB (bayesian method with flat prior for rB and |Ccos| ) signal from ML fit Likelihood of RADS submission to journal imminent Measurement of g: Status and Prospects
ADS: Summary of Results • No signal observed so far: only upper limits on rB B-D0K-, D0K+p- B-D*0[D0p0]K-, D0K+p- B-D*0[D0g]K-, D0K+p- B-D0K*-, D0K+p- B-D0K-, D0K+p-p0 Measurement of g: Status and Prospects
B±D0K± with D0p+p-p0 Measurement of g: Status and Prospects
r+=0.75±0.11±0.06 r-=0.72±0.11±0.06 q+=(147±23±13)o q-=(173±42±19)o Method • First measurement of CP parameters with this channel • Compared to B-D0K-, D0K0sp+p-: • ~0.5 signal yield (on 324x106 BB: 170±29 vs. 398±23) • larger background • different D Dalitz structure • exploits constraint of expected number of events in Likelihood • extracts r± , q± instead of x±, y±, defined as: f= D Dalitz amplitude D0p+p-p0 DP Measurement of g: Status and Prospects
Results this measurement alone:g= 25±48 @ 68%CL* [-67,97] @ 95%CL BDK,Dppp0 * UTfit, bayesian procedure Measurement of g: Status and Prospects
sin(2b+g) with time-dependent CP asymmetries of B0D(*)-p+/r+ Measurement of g: Status and Prospects
The Method • S± and C measured from time-dependent rates • BUT r too small to be extracted from C ==> r fixed using external input + SU(3) [see later] + mixing 2b 2b+g+ d from B0 mixing relative strong phase from Vub ~ 0.02 Measurement of g: Status and Prospects
232 106 BB Selection of signal • partial reconstruction of BD*+p- (in D*+D0p+, D0 is NOT reconstructed) • full reconstruction of BD+p-, D*+p-, D+r- all tags BD+p- 232 106 BB lepton tag 18710±270 Pur~50% BD*+p- kaon tag 70580±660 Pur~30% BD+r- mmiss = missing mass of D0 • high purity • very high reco. efficiency • lower purity (B tag-dependent) • only B0D*p Measurement of g: Status and Prospects
(h=±1 for ) 0 with lepton tag Fit to the Time-dependent Rates partial reco, lepton tag full reco, lepton tag • Since the CP asym. of signal is small, the effect of bu vs. bc interference in the Btag must be taken into account. Introduction of CPV parameters of the tag side (r’, d’) Brec=D*+p- Btag=B0 Brec=D*-p+ Btag=B0bar Brec=D*-p+ Btag=B0 Brec=D*+p- Btag=B0bar 10 -10 10 -10 Dt (ps) a,b,c measured from time-dep fit. a,c used to constrain 2b+g Measurement of g: Status and Prospects
The Results results from the time-dep fit estimation of rD(*)h full reco partial reco • neglects exchange diagrams, • uses fD/fDs to take into account SU(3) break. • assumes factorization (a 30% relative error to these assumptions is applied) see also Baak’s talk at CKM2006 BaBar full reco + partial reco BaBar+Belle 2b+g = -90±33 |sin(2b+g)|>0.64 (0.40) @ 68% (90%) CL Measurement of g: Status and Prospects
Other Methods Measurement of g: Status and Prospects
B0D(*)0K(*)0 • Interesting channel for the future. • Can measure g using B0D0K*0 vs. B0D0K*0 (K*0K+p- self-tagging) as B-D0K- • Can measure sin(2b+g) using time-dep B0D0KS0 • expected large rB (naïve estimate: rB ~ 0.4) still too few sig. events for time-dep analysis From using bayesian procedure constraining g with B0D(*)0K(*)0 could be harder than originally hoped @90% CL Measurement of g: Status and Prospects
Combination Babar + Belle Babar + Belle Measurement of g: Status and Prospects
g with 1ab-1 and beyond possibly to be replaced with new one Measurement of g: Status and Prospects
Summary Measurement of g: Status and Prospects
End Measurement of g: Status and Prospects
Likelihood used to extract signal yields and x,y Measurement of g: Status and Prospects