Download

1 / 54
540 likes | 668 Views
Energy Balance--- What should we teach our students?. Energy Balance--- What should the textbooks teach our students?. Itzick Vatnick ---Widener University URL: htpp://science.widener.edu/~vatnick email vatnick@pop1.science.widener.edu. HAPS 17 th Annual Conference. Energy Balance. in.

E N D
Energy Balance--- What should we teach our students? Energy Balance--- What should the textbooks teach our students? Itzick Vatnick ---Widener University URL: htpp://science.widener.edu/~vatnick email vatnick@pop1.science.widener.edu HAPS 17th Annual Conference
Energy Balance in out Body weight
Negative Energy Balance in out Body weight
Positive Energy Balance out in Body weight
Energy in home.wanadoo.nl/fox-1/ farside/eating.gif Editorial comment: No more Larson? How do we measure energy in foods?
kilocalorie (kcal): • eg. a half cup of peanut butter contains ~750 kcal; or enough energy to heat 750 L of water by 1°C !! • SI unit is the kilojoule (kJ): kcal x 4.184 • energy content of food measured by direct calorimetry • complete combustion of known amount of food in a sealed, insulated container measure increase in temperature of surrounding water jacket known as bomb calorimetry http://www.uoguelph.ca/hb+ns/NUTR4210/BasicNotes.pdf
Gross energy content of macronutrients, determined by combustion • carbohydrate: 4.2 kcal per gram • fat: 9.4 kcal per gram (due to greater relative hydrogen content) • protein: 5.6 kcal per gram • Actual (net) energy content of macronutrients (called Atwater General Factors) • loss of H atoms as urea (ie. loss of protein energy) • coefficient of digestibility • ß usually > 90%, some variability • ß reduced by dietary fiber • ß generally NOT different between lean and obese individuals !! http://www.uoguelph.ca/hb+ns/NUTR4210/BasicNotes.pdf
Macronutrient Atwater General Factor Carbohydrate 4 kcal per gram Fat 9 kcal per gram Protein 4 kcal per gram http://www.uoguelph.ca/hb+ns/NUTR4210/BasicNotes.pdf
Respiratory Exchange Ratio (RER) VCO2 / VO2; reflects “blend” of fat/CHO oxidized 0.70, pure fat 1.00, pure carbohydrate assume negligible contribution from protein (i.e. non-protein RQ) C6H12O6 + 6 O2 6 CO2 + 6 H2O (RER = 6 CO2 / 6 O2 = 1.00) C16H32O2 + 23 O2 16 CO2 + 16 H2O (RER = 16 CO2 / 23 O2 = 0.70) measured at lungs (i.e. whole body), but in theory, reflective of Respiratory quotient (RQ; at level of mitochondrion) influenced by non-steady state conditions (VCO2) http://www.uoguelph.ca/hb+ns/NUTR4210/BasicNotes.pdf
RER is a relatively sensitive scale i.e. differences of 0.02 units translate to substantial differences in energy derived from each substrate Example: exercise at ~ 75% VO2 max (3.0 L/min) for 60 min If average RER = 0.80 (i.e. 2.4 / 3.0): 4.801 kcal/L O2 x 3.0 L/min x 60 min = 864 kcal 33.4 % kcal from CHO = 289 kcal 66.6 % kcal from fat = 575 kcal If average RER = 0.82 (i.e. 2.46 / 3.0): 4.825 kcal/L O2 x 3.0 L/min x 60 min = 869 kcal 40.3 % kcal from CHO = 350 kcal 59.7 % kcal from fat = 519 kcal http://www.uoguelph.ca/hb+ns/NUTR4210/BasicNotes.pdf
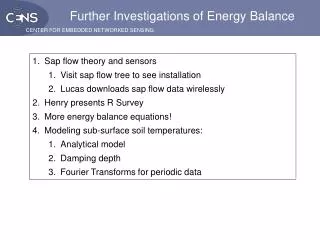
Energy OUT Total Daily Energy Expenditure (TDEE) RMR TEF TA
Total Daily Energy Expenditure (TDEE) • RMR • Resting/basal Metabolic Rate (60-75%) “essential” (maintenance of ionic gradients, substrate cycles, etc.) • ion homeostasis, 40-60% (20-30% from Na/K ATPase alone) • protein turnover, 25% • mitochondrial uncoupling, 20-30% http://www.uoguelph.ca/hb+ns/NUTR4210/BasicNotes.pdf
main contributing tissues: skeletal muscle and liver (despite its small mass!) Tissue Contribution (%) Mass (%) Liver 26 3 Muscle 26 40 Brain 18 2 Heart 9 < 1 Kidneys 7 < 1 other 14 http://www.uoguelph.ca/hb+ns/NUTR4210/BasicNotes.pdf
Total Daily Energy Expenditure (TDEE) • TEF-- Thermic Effect of Food • Also known as specific dynamic action (SDA) and heat increment of feeding (HIF) • obligatory (digesting, absorbing, assimilating) • facultative (stimulatory effect on metabolism, SNS) • mixed meal elevates RMR by 25-50%, but only lasts ~2-4 hours • splanchnic (gut, liver, pancreas) VO2 increases 50% • muscle (leg) VO2 increases 30% • thermic effect reduced in obese individuals http://www.uoguelph.ca/hb+ns/NUTR4210/BasicNotes.pdf
also, note that the metabolic consequences of individual macronutrients differ considerably • amino acids; 50% increase in splanchnic VO2 • glucose; 8-13% increase in muscle VO2 • fat; little change in VO2 http://www.uoguelph.ca/hb+ns/NUTR4210/BasicNotes.pdf
Total Daily Energy Expenditure (TDEE) PA Physical Activity (15-30%) http://www.uoguelph.ca/hb+ns/NUTR4210/BasicNotes.pdf
Energy Balance RMR TEF PA Food Body weight
What controls energy intake? The glucostatic theory The liposatic theory
ob/ob mouse Science 1996 December 6; 274: 1704-1707.
Science 1996 December 6; 274: 1704-1707. Fig. 1. Physical appearance and body weights of normal (OB/OB), ob/ob, and NPY/ ob/ob mice. (A) Representative body shapes of male mice at 15 weeks of age. Photo was cropped at mid-tail level. (B and C) Body weights of male and female mice at various ages. Values are the mean ± SEM; n > 10 for each group.
Science 1996 December 6; 274: 1704-1707. Body weight of NPY/ ob/ob females was significantly lower than that of ob/ob females at all ages after 6 weeks (P < 0.01). Body weight of NPY/ ob/ob males was significantly lower than that of ob/ob males at all ages after 10 weeks (P < 0.02).
Science 1996 December 6; 274: 1704-1707. Fig. 2. Adiposity of normal, ob/ob, and NPY/ ob/ob mice. (A) Fat-selective magnetic resonance images (MRIs) of male mice at 14 weeks of age (12). Images are 3-mm thick, body length, horizontal sections. Adipose tissue appears white. Images are oriented such that the head of each mouse is at the top. The sides of the ob/ob image are straight because the mouse was pressed against the walls of the MR tube.
Science 1996 December 6; 274: 1704-1707. (B) Average lipid:water ratios of 12- to 15-week-old mice obtained from MR spectra (12). Values are the mean ± SEM. Each group consisted of four males and three females. *P < 0.001 compared to ob/ob mice; unpaired t-test. Some ob/ob mice, but not double mutants, could not be analyzed by this technique because they were too large to fit into the 4.2-cm-diameter coil. Consequently, the adiposity of ob/ob mice was slightly underestimated. (C) Combined weights of inguinal, retroperitoneal, scapular, and reproductive pads, measured when mice were 16 weeks of age. Values are the mean ± SEM. The ob/ob group consisted of 19 males and 15 females; the double mutant group consisted of 12 males and 10 females. **P < 0.001 compared to ob/ob mice, unpaired t-test.
The evidence so far… Glucostatictheory Lipostatic theory A few years later ….
Candidate signaling molecules involved in energy homeostasis
The evidence so far… Glucostatictheory Lipostatic theory
A simplified model of the action of ghrelin and leptin on feeding-regulatory circuitry. Leptin acts as part of a feedback loop to maintain constant stores of fat5. Leptin is released from adipocytes as a function of the amount of fat, and reduces food intake by acting on two hypothalamic pathways. It stimulates an anorexigenic pathway and inhibits anorexigenic pathway; both of them originate in the arcuate nucleus of the hypothalamus andproject to the paraventricular nucleus and the lateral hypothalamic area Ghrelin is released from the stomach. The effect of ghrelin in the hypothalamus is opposite to that of leptin; in other words, ghrelin acts as an orexigenic molecule. In addition, ghrelin stimulates both energy gain and the secretion of growth hormone (GH) by acting directly on the anteriorpituitary. So, the action of ghrelin constitutes an integrated means to produce an anabolic state and growth. Fasting decreases leptin and increases ghrelin production, leading to the activation of the orexigenic pathway. This response might be important for adaptation to fasting. Although ghrelin is also produced by hypothalamic cells, it remains to be seen whether this source has a similar action to ghrelin produced by the stomach. GHRH, growth-hormone-releasing hormone. Nature Reviews Neuroscience 2; 551-560 (2001);
UNCOUPLING PROTEINS A 32 000 molecular weight uncoupling protein (now termed uncoupling protein-1, or UCP1) located in the inner mitochondrial membrane of BAT. UCP1, which exists in active and inactive forms, is unique to brown fat and as such differentiates the two forms of adipose tissue (brown and white); it also appears to be restricted to mammals. A family of mammalian uncoupling proteins has now been identified – UCP1, UCP2, UPC3, BMCP1 (and perhaps UCP4) – with homologues in birds and plants. UCP2 has a wide tissuedistribution, but is found particularly in white adipose tissue and cells of the immune system, while UCP3 is primarily expressed in skeletal muscle. Although these proteins were initially thought to act as uncouplers in a manner analogous to UCP1, it is increasingly clear that this is not the case. UCP2 and UCP3 may in practice be involved in lipid oxidation or play a role in antioxidant defence. A role for UCP1 and for brown adipose tissue as a locus for adaptive thermogenesis in relation to energy balance, as well as in thermoregulation, in rodents is well established. However, the extent to which brown fat thermogenesis normally occurs in adult humans remains problematic. Nevertheless,UCP1 is present in certain adipose tissue depots throughout life and increased levels (indicating activation of brown fat) are evident in patients with pheochromocytoma. Research Symposium – Human Energy Metabolism J Physiol (2003) 547.S Paul Trayhurn
A new view on… www.deltagen.com/.../ adipose_tissue_white_40x.jpg
www.nature.com/tpj The pharmacogenomics journal (2202) 2 :4-7 Ravussin, E.
www.nature.com/tpj The pharmacogenomics journal (2202) 2 :4-7 Ravussin, E.
The seminal proposal by Steppan et al. suggested resistin to be a hormone that links obesity to diabetes. It was originally named for its resistance to insulin. Resistin serum levels were increased in obesity and resistin gene expression was induced during adipocyte differentiation (Fig. 1).