Download
1 / 58
580 likes | 721 Views
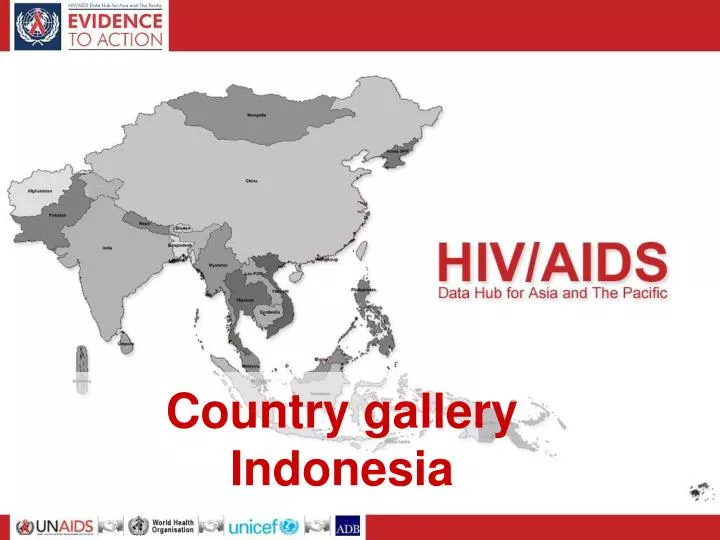
Country gallery Indonesia. Basic socio-demographic indicators, 2007-2008. Source: 1. 2007 UN Population Division cited in WHO, UNAIDS and UNICEF, Epidemiological Fact Sheet on HIV and AIDS: Indonesia, July 2008 2. UNDP, Human Development Report, 2007/2008.

E N D
Basic socio-demographic indicators, 2007-2008 Source: 1. 2007 UN Population Division cited in WHO, UNAIDS and UNICEF, Epidemiological Fact Sheet on HIV and AIDS: Indonesia, July 2008 2. UNDP, Human Development Report, 2007/2008
% of most-at-risk populations who are HIV infected, 2007 HIV prevalence among IDUs is sky-rocketing and is the major cause of Indonesian epidemic Source: UNAIDS, UNGASS Country Report Indonesia January 2006 to December 2007
HIV prevalence among most-at-risk populations in recent years Source: Ministry of Health, Sentinel Surveillance data, 2006
Trend of HIV prevalence among IDUs, 1997-2005 Source:: CDC-EH_WHO, Briefing Document prepared for External Review of the Health Sector Response to the HIV/AIDS Epidemic in Indonesia, 5-17 Feb 2007
Trend of HIV prevalence among FSWs and IDUs within 10 years in Jakarta, 1997-2005 Source: Ministry of Health, Sentinel Surveillance data, 2006
Trend of HIV prevalence among FSWs in Sorong district, 1998-2005 Source:: CDC-EH_WHO, Briefing Document prepared for External Review of the Health Sector Response to the HIV/AIDS Epidemic in Indonesia, 5-17 Feb 2007
HIV prevalence among transgender, Jakarta, 1997-2004 Source: MoH, National Estimates of Adult HIV Infection, 2002; UNAIDS/WHO Epidemiological Fact Sheets, 2006; UNAIDS,UNGASS country Report, 2005 and Ministry of Health, Indonesia. Results from the Behavioral Surveillance Survey (BSS) in Indonesia 2004-2005. 2005
HIV prevalence among adults 15-49 and young people 15-24, 2001-2007 Source: 1. Indonesia_UNAIDS, Epidemiological Fact Sheets, 2008 Update 2. UNAIDS_Report on the Global AIDS Epidemic, 2006
Estimated number of people living with HIV, 2001-2007 Source: 2008 Report on the global AIDS epidemic, UNAIDS/WHO, July 2008
Cumulative percent of AIDS cases by age, 2007 Majority of Cumulative AIDS cases were recorded In the age group 20-29 yrs Source: Ministry of Health, Indonesia. HIV/AIDS report, Directorate General of Disease Control and Environmental Health, March 2007 update
Reported and projected infections in various low and high-risk populations, 1989-2020 Source: Pandu Riono-Family Health International. Pemodelan Matematik Tren Epidemi HIV-AIDS Indonesia Sampai 2020. 2006
Trend of HIV epidemic in Indonesia, 1989-2019 Source: Pandu Riono-Family Health International. Pemodelan Matematik Tren Epidemi HIV-AIDS Indonesia Sampai 2020. 2006
% of most-at-risk populations with comprehensive knowledge, 2004 vs. 2007 The knowledge among FSWs and IDUs has increased whereas among MSM it is declined slightly over the time. Comprehensive knowledge of HIV&AIDS: Percentage of people who both correctly identify ways of preventing the sexual transmission of HIV and who reject major misconceptions (UNGASS definition) Source: 1. UNAIDS, UNGASS Country Report Indonesia January 2006 to December 2007 2. UNAIDS, Report on the Global AIDS Epidemic, 2006
50 2002 43.3 45 Percent (%) 2004 40 35 30 23.8 23.7 25 20 16.2 13.9 15 10 6.7 5 0 0 0 FSWs Clients of FSWs MSM IDU % of most-at-risk populations with comprehensive knowledge of HIV & AIDS, 2002 vs. 2004-05 Comprehensive knowledge of HIV&AIDS: Percentage of people who both correctly identify ways of preventing the sexual transmission of HIV and who reject major misconceptions (UNGASS definition) Source: Ministry of Health, Indonesia. Behavioral Surveillance Survey (BSS) result in Indonesia 2004-2005. Jakarta, September 2005
% of population 15-49 yrs who know about HIV prevention ways, 2002-2003 Source: BKKBN/ORC Macro, Demographic and Health Survey, 2002-2003
100 (%) 74.3 75 63 52.4 46.4 50 27.5 23.8 25 6.3 0 Rural Urban No education Junior secondary Senior secondary Higher secondary Elementary education Residence Education of women % of women 15-49 yrs who know that HIV can be transmitted from an infected mother to her child, by residence and education, 2000 Source: BPS_UNICEF, End Decade Statistical Report: Data and Descriptive Analysis, 2000
% of population 15-49 yrs who have heard of HIV & AIDS, 2002-2003 National average Female = 58.8 % Male = 72.8 % Source: BKKBN/ORC Macro, Demographic and Health Survey, 2002-2003
% of female 15-24 yrs with comprehensive knowledge of HIV & AIDS, 2003 Comprehensive knowledge of HIV&AIDS: Percentage of people who both correctly identify ways of preventing the sexual transmission of HIV and who reject major misconceptions (UNGASS definition) Source: UNAIDS, Report on the Global AIDS Epidemic, 2006
% of population 13-15 yrs and 15-24 yrs, with comprehensive knowledge in East Java, 2004 Comprehensive knowledge of HIV&AIDS: Percentage of people who both correctly identify ways of preventing the sexual transmission of HIV and who reject major misconceptions (UNGASS definition) Source: UNICEF, Population Council - Final Report of Baseline Data Collection on Young People and HIV/AIDS Prevention in Selected Islamic Schools in East Java, 2004
% of population 13-15 yrs and 15-24 yrs, who have heard of HIV/AIDS in East Java, 2004 Source: UNICEF, Population Council - Final Report of Baseline Data Collection on Young People and HIV/AIDS Prevention in Selected Islamic Schools in East Java, 2004
% of most-at-risk populations reporting the use of a condom during recent and past commercial encounters, 2004-2005 Source: Behavioral Surveillance Survey (BSS) result in Indonesia 2004-2005. MoH, Jakarta, September 2005
Male sex workers 147.1 / US 15 $ Transsexuals 58.6 / US 6 $ Indirect FSWs 322.1 / US 33 $ Direct FSWs 92.8 / US 10 $ 0 50 100 150 200 250 300 350 Thousand Rupiahs / US $ Average prices charged for commercial sex by various most-at-risk populations, 2004-05 Source: Behavioral Surveillance Survey (BSS) result in Indonesia 2004-2005. MoH, Jakarta, September 2005
Chain of multiple sexual partnerships and risks of HIV transmission in Jakarta & Surabaya, 2004-2005 General population through pregnant women Source: Behavioral Surveillance Survey (BSS) result in Indonesia 2004-2005. MoH, Jakarta, September 2005
% of IDUs reporting the use of a condom the last time they had sexual intercourse, 2007 Source: UNAIDS, UNGASS Country Report Indonesia January 2006 to December 2007
% of IDUs reporting commercial sex during the past 12 months, 2004-2005 Source: Behavioral Surveillance Survey (BSS) result in Indonesia 2004-2005. MoH, Jakarta, September 2005
30 Female 27.3 Percent (%) Male 25 All 23.1 19.2 19.1 18.9 18.5 20 18 14 15 8.7 10 5 0 <25 yrs. >25 yrs. All % of IDUs who have used condoms and avoided sharing injecting equipment, 2004-2005 Source: Behavioral Surveillance Survey (BSS) result in Indonesia 2004-2005. MoH, Jakarta, September 2005
% of IDUs reporting the use of sterile equipment the last time they injected, 2007 Source: UNAIDS, UNGASS Country Report Indonesia January 2006 to December 2007
% of IDUs who used their own needles/syringe, by contact with NGO, 2004-2005 Source: Behavioral Surveillance Survey (BSS) result in Indonesia 2004-2005. MoH, Jakarta, September 2005
% of IDUs by safe injecting behavior, 2004-2005 Source: Behavioral Surveillance Survey (BSS) result in Indonesia 2004-2005. MoH, Jakarta, September 2005
% of FSWs and MSWs reporting the use of a condom during sex with most recent client, 2004 Vs. 2007 Source:1. Behavioral Surveillance Survey (BSS) result in Indonesia 2004-2005. MoH, Jakarta, September 2005 2. UNAIDS, UNGASS Country Report Indonesia January 2006 to December 2007
% of FSWs and MSWs reporting the use of a condom during sex with most recent client, 2002 and 2004 UNAIDS recommendation Source: Behavioral Surveillance Survey (BSS) result in Indonesia 2004-2005. MoH, Jakarta, September 2005
% of MSM reporting unprotected sex with different partners, 2004-05 Source: Behavioral Surveillance Survey (BSS) result in Indonesia 2004-2005. MoH, Jakarta, September 2005
% of men reporting the use of a condom the last time they had anal sex with a male partner, 2004-2005 Vs. 2007 Condom use among MSM has decreased significantly over time Source:1. Behavioral Surveillance Survey (BSS) result in Indonesia 2004-2005. MoH, Jakarta, September 2005 2. UNAIDS, UNGASS Country Report Indonesia January 2006 to December 2007
% of men reporting the use of a condom the last time they had anal sex with a male partner, 2004-2005 Source: 1. UNAIDS, UNGASS Country Report, Indonesia, 2005 & 2. Behavioral Surveillance Survey (BSS) result in Indonesia 2004-2005. Jakarta, September 2005
% of men who engaged in male-male sex in the past 12 months, 2004-2005 Source: Behavioral Surveillance Survey (BSS) result in Indonesia 2004-2005. MoH, Jakarta, September 2005
% of men in high-risk occupation who paid for sex in the past 12 months, 2004-2005 Source: Behavioral Surveillance Survey (BSS) result in Indonesia 2004-2005. MoH, Jakarta, September 2005
% of men in high-risk occupation reporting the use of a condom during sex, 2004-2005 Source: Behavioral Surveillance Survey (BSS) result in Indonesia 2004-2005. MoH, Jakarta, September 2005
% of young people who had premarital sex during the last 12 months, 2004-2005 The details about age groups of these young people are not given in the survey report. However, they were said to be high school students. Source: Behavioral Surveillance Survey (BSS) result in Indonesia 2004-2005. MoH, Jakarta, September 2005
Gap between knowledge and practice among young people in Indonesia, 2002 Source: UNICEF. Regional Update of UNICED Action: HIV/AIDS, children and youth, mother and babies in East Asia and the Pacific. December 2002
% of most-at-risk populations who have been tested for HIV in the past 12 months and who know their results, 2005 Vs. 2007 Source:1. Behavioral Surveillance Survey (BSS) Indonesia 2004-2005 MoH, Jakarta September 2005 Jakarta, September 2005 2. UNAIDS, UNGASS Country Report Indonesia January 2006 to December 2007
% of most-at-risk population reached by HIV prevention programs, by age, 2007 Source: UNAIDS, UNGASS Country Report Indonesia January 2006 to December 2007
% of most-at-risk population reached by HIV prevention programs, 2004-2005 Source: Behavioral Surveillance Survey (BSS) result in Indonesia 2004-2005. MoH, Jakarta, September 2005
No 8% Yes 92% % of women who have access to antenatal care, 2003-2005 Source:: UNICEF PMTCT Report Card 2005
Number of HIV+ pregnant women who are in need of and who are receiving ART to prevent mother-to-child transmission of HIV, 2007 2-4 % of HIV+ pregnant women are receiving ART to prevent mother-to-child transmission of HIV Source: WHO_UNAIDS_UNICEF_Towards Universal Access – Scaling up priority HIV/AIDS interventions in the health sector, 2008
% of HIV+ pregnant women who received antiretroviral to reduce the risk of mother to child transmission of HIV, 2007 Source: UNAIDS, UNGASS Country Report Indonesia January 2006 to December 2007