Download
1 / 10
100 likes | 251 Views
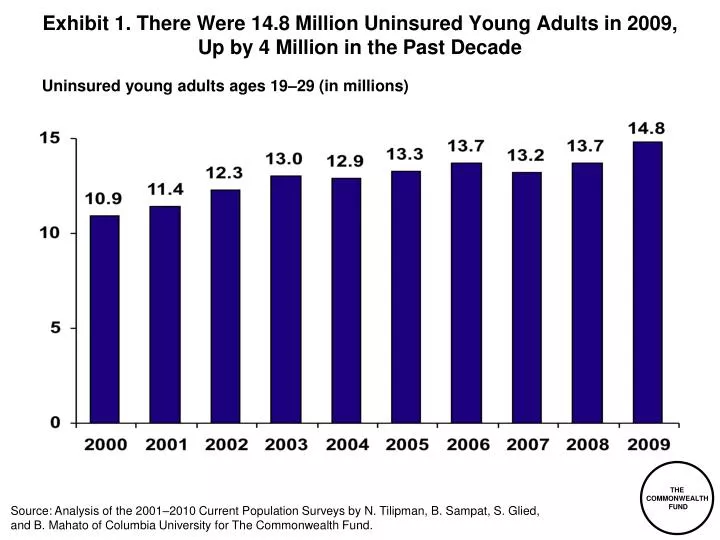
Exhibit 1 . There Were 14.8 Million Uninsured Young Adults in 2009, Up by 4 Million in the Past Decade. THE COMMONWEALTH FUND. Uninsured young adults ages 19–29 (in millions).

E N D
Exhibit 1. There Were 14.8 Million Uninsured Young Adults in 2009,Up by 4 Million in the Past Decade THE COMMONWEALTH FUND Uninsured young adults ages 19–29 (in millions) Source: Analysis of the 2001–2010 Current Population Surveys by N. Tilipman, B. Sampat, S. Glied, and B. Mahato of Columbia University for The Commonwealth Fund.
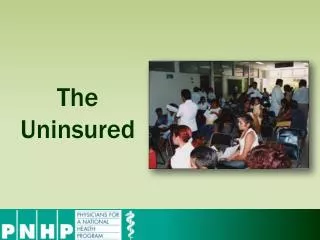
Exhibit 2.Distribution of 14.8 Million Uninsured Young Adults in 2009, by Income Level THE COMMONWEALTH FUND 133%–249% FPL 3.4 million23% Subsidized private coverage with consumer protections Medicaid <133% FPL 7.2 million 49% 250%–399% FPL 1.5 million10% Nonsubsidized private coverage with consumer protections or parents’ policies >400% FPL 930,238 6% Undocumented 1.8 million 12% 14.8 million uninsured young adults ages 19–29 Note: FPL refers to Federal Poverty Level. Source: Analysis of the March 2010 Current Population Survey by N. Tilipman and B. Sampat of Columbia University for The Commonwealth Fund; estimates of undocumented uninsured young adults by Jonathan Gruber and Ian Perry of MIT using the Gruber Microsimulation Model for The Commonwealth Fund.
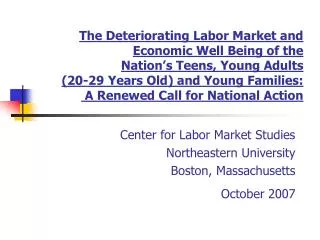
THE COMMONWEALTH FUND Exhibit 3. Half of Young Adults with Low and Moderate Incomes Went Without Needed Care Because of Its Cost in 2010 Percent of young adults ages 19–29 who had any of four access problems* in past year because of cost, by income level Note: FPL refers to Federal Poverty Level. * Did not fill a prescription; did not see a specialist when needed; skipped recommended medical test, treatment, or follow-up; had a medical problem but did not visit doctor or clinic. Source: The Commonwealth Fund Biennial Health Insurance Surveys (2001 and 2010).
THE COMMONWEALTH FUND Exhibit 4. Medical Debt and Bill Problems Worsened for Young Adults with Low and Moderate Incomes Percent of young adults ages 19–29 with medical bill problems or accrued medical debt,* by income level Note: FPL refers to Federal Poverty Level. * Had problems paying medical bills, contacted by a collection agency for unpaid bills, had to change way of life in order to pay medical bills, or has outstanding medical debt. Source: The Commonwealth Fund Biennial Health Insurance Surveys (2005 and 2010).
THE COMMONWEALTH FUND
Exhibit 6. Four of 10 Young Adults Ages 19–29 Who Had Insurance Through Their Parent’s Employer While in High School Lost or Had to Switch Insurance After High School; Almost Half Went Without Insurance for Two Years or More THE COMMONWEALTH FUND What happened to health insurance when graduated from or left high school Length of time without insurance* Don’t know/ refused 1% Don’t know/ refused 2% <1 month 3% >1 month to <6 months 13% Lost insurance 27% 6 months to <1 year 15% 2 years or more 46% Continued to get insurance through same source 56% Switched to a new source 15% 1 year to <2 years 23% * Among those who had a gap between losing and gaining new insurance, or who went without insurance after graduating from or leaving high school, or who did not have insurance when they graduated from or left high school. Note: Numbers may not sum to 100% because of rounding. Source: The Commonwealth Fund Survey of Young Adults (2009).
Exhibit 7. Three-Quarters of Young Adults Ages 19–29 Who Had Insurance Through Their Parent’s Employer While in College Lost or Had to Switch Insurance After College THE COMMONWEALTH FUND What happened to health insurance when graduated from or left college Length of time without insurance* Don’t know/ refused 1% Don’t know/ refused 1% Did not have insurance 2% <1 month 14% Continued to get insurance through same source 23% 2 years or more 23% Lost insurance 32% >1 month to <6 months 33% 1 year to <2 years 14% Switched to a new source 43% 6 months to <1 year 15% * Among those who had a gap between losing and gaining new insurance, or who went without insurance after graduating from or leaving college, or who did not have insurance when they graduated from or left college. Note: Numbers may not sum to 100% because of rounding. Source: The Commonwealth Fund Survey of Young Adults (2009).
Exhibit 8. Under the health reform law, many provisions will make it easier for young adults to remain covered after they graduate. Do you think this is a major improvementinthehealthcaresystem,aminorimprovement,notanimprovement, do you think it makes things worse, or do you not know enough to say? THE COMMONWEALTH FUND Young adults ages 19–29, by political affiliation 78 69 68 63 Note: FPL refers to Federal Poverty Level. Source: The Commonwealth Fund Biennial Health Insurance Survey (2010).
Exhibit 9. Percentage of Uninsured Young Adults Ages 19–29Is Triple the Rate of Children Age 18 and Under THE COMMONWEALTH FUND Note: FPL refers to Federal Poverty Level. Source: Analysis of the March 2010 Current Population Survey by N. Tilipman and B. Sampat of Columbia University for The Commonwealth Fund.
Exhibit 10. Under the Affordable Care Act, Young Adults Will Benefit from Newly Subsidized Sources of Health Insurance Percent of young adults ages 19–29 Note: FPL refers to Federal Poverty Level. Income levels are by 2010 poverty levels, for an individual. *Includes: had problems paying or unable to pay medical bills; contacted by collection agency for unpaid medical bills; had to change way of life to pay bills; medical bills being paid off over time. **Includes any of the following because of cost: had a medical problem, did not visit doctor or clinic; did not fill a prescription; skipped recommended test, treatment, or follow-up; did not get needed specialist care. ***Base: Respondents who specified income level and premium/out-of-pocket costs for combined individual/family medical expenses. ^ Analysis of the March 2010 Current Population Survey by N. Tilipman and B. Sampat of Columbia University for The Commonwealth Fund. ^^ The Commonwealth Fund Biennial Health Insurance Survey (2010). THE COMMONWEALTH FUND