Download
1 / 52
520 likes | 643 Views
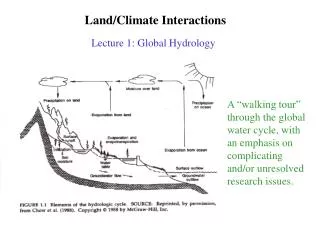
Carbon-Water-Climate Interactions. Dennis P. Lettenmaier Ted Bohn Department of Civil and Environmental Engineering University of Washington for NEESPI Science Team Meeting Vienna February 22, 2006. Outline. Distribution of carbon in the climate system Sources/sinks Transformations

E N D
Carbon-Water-Climate Interactions Dennis P. Lettenmaier Ted Bohn Department of Civil and Environmental Engineering University of Washington for NEESPI Science Team Meeting Vienna February 22, 2006
Outline • Distribution of carbon in the climate system • Sources/sinks • Transformations • Carbon-water-climate interactions • Specific freshwater-influenced interactions • Wetlands • Rivers • Modeling perspective
Hydrologic Cycle Atmosphere Precip Transpiration Evap Evap Evap Evap Evap Precip Terrestrial Biosphere Throughfall Snow Surface Runoff Wetlands Upper Ocean Subsurface Runoff Soil Rivers Ocean Bottom Permafrost
Carbon Cycle (to stratosphere) CH4 oxidation Atmosphere OH- + CH4 H2O + CH3- CO2 CH4 Rh NPP CH4 CO2 CH4 Fires CO2 CO2 CO2 ruminants, termites, and plants Rh NPP Terrestrial Biosphere* Respiration & outgassing Litter phytoplankton Combustion of fossil fuels microbial respiration Wetlands Upper Ocean Org C CO2 CH4 microbial methanogenesis Burial Burial Org C DOC Soil Rivers Ocean Bottom * Excluding soil microbes
Distribution of Carbon in the Climate System CO2: 380 ppm CH4: 1.75 ppm Influenced by Hydrology Storages: Gt C Fluxes: Gt C yr-1 (IPCC 2001)
Terrestrial Carbon Stocks (IPCC 2001) • Wetland soils store the most carbon per unit area • Wetland extent depends on hydrology • Wetland behavior depends on hydrology
High-Latitude Carbon Stocks • High latitudes comprise much of NEESPI domain • 20-60% of global soil carbon pool stored in high-latitude soils (Schlesinger 1977, Post et al 1982, Post et al 1985, Oechel 1989, Gorham 1991, Chapin & Matthews 1992)
Sources of Atmospheric C • Respiration (autotrophic and heterotrophic) • Burning of fossil fuels • over past 2 centuries, source of 480-500 Gt (Pg) C (IPCC 2001) • comparable in size to terrestrial plant pool • current rate: 5.3 GtCyr-1 (IPCC 2001) • Natural fires • Outgassing of CO2: • from fresh water: 0.9 GtCyr-1 (Richey et al 2002) • from ocean • from soils • Methane (CH4) production: • CH4 has 23 times the greenhouse potential of CO2
Sinks of Atmospheric C • Gross Primary Production (GPP) (terrestrial and oceanic) • Post-fire recovery • Dissolution of CO2 into: • precipitation • freshwater • oceans • soils • Methane oxidation in stratosphere
Either sources or sinks • Changes in land use • Over past 2 centuries, deforestation = source of 180-200 Gt (Pg) C (IPCC 2001) • Reforestation of abandoned farmland = sink of up to 100 Gt (Pg) C (IPCC 2001) • Fire and other disturbances • Initial source followed by sink until equilibrium again • Change in disturbance frequency can cause biological & soil pools to grow/shrink
Transformations • Oxidation of CH4 • Stratosphere: 0.5 GtCyr-1 • Microbes in unsaturated soil in wetlands • Riverine transport of C from terrestrial to oceanic pools • 0.4-1.2 GtCyr-1 (Richey et al 2002) • Burial in deep sediments (land/ocean)
Global Methane Sources/Sinks (Mt CH4 yr-1) Influenced by Hydrology These numbers may be revised in light of recent estimates of plant emissions of 63-243 MtCyr-1 (Keppler et al 2006) (Lowe 2006)
Interactions (a partial list) below saturation CO2 uptake NPP waterlogging CO2 fert. evaporation permafrost Soil Moisture outgassing, respiration evaporation Atm [CO2] Surface T precipitation greenhouse Atm [CH4] albedo, sensible/ latent heat flux plants, wetlands, ruminants, etc. Species Distrib. evaporation greenhouse clouds transpiration negative Atm [H2O] positive precipitation either
Feedbacks – non-hydrological Negative: • CO2 fertilization • Higher rate of NPP • CO2 fertilization effect may decrease in amplitude at higher levels of CO2 (Fung et al 2005) • Dissolution of more CO2, CH4 into oceans, freshwater • This may have very limited effect
Feedbacks – non-hydrological Positive: • Increase in CH4 production in plants (Keppler et al 2006) • Emissions of CO2 from soils (Bellamy et al 2005)
Feedbacks - hydrological Positive: • Water vapor feedback • Snow/Ice albedo Uncertain direction: • Clouds • Change in species distribution • replacement of moss with shrubs = less evaporation = warmer T • expansion of forests = more evaporation = cooler T; but possibly lower albedo (if coniferous) = warmer T
High-latitude climate feedbacks Hydrology influences all of these Response time (y) (Chapin et al 2000)
High-latitude climate feedbacks Hydrology influences all of these (Chapin et al 2000)
Wetlands • Competing processes: • Carbon sink (peat accumulation) • Methane source • Hydrology plays key role: • Wetland extent • Balance between CO2, CH4
Global Distribution of Wetlands (GLWD-3, Lehner and Doll 2004)
Global Wetland Distribution (Lehner and Doll 2004) Areas in 103 km2 Eurasia contains 30-50% of world’s wetlands
Wetland Peat Accumulation Rates: • All northern peatlands: 0.07 GtCyr-1 (Clymo et al 1998) • Historical average rate during Holocene: • Pan-Arctic: 97 TgCyr-1 (0.097 GtCYr-1) or 28 gCm-2yr-1 (Corradi et al 2005) • West Siberia: 6.1 TgCyr-1 (0.0061 GtCyr-1) or 12 gCm-2yr-1 (Smith et al 2004) Peat accumulation depends on: • NPP • Species assemblage • pH • Soil T • Water table depth • Thaw depth (where present) • Leaching of DOC These influence each other, but hydrology influences all of them
Wetland CH4 Emissions Rates: • Global: 0.09-0.24 TgCyr-1 (IPCC 2001) • Can be up to 25% of CO2 uptake (Corradi et al 2005), or 5 X greenhouse potential of CO2 uptake • Historical average rate during Holocene: • West Siberia: 0.3-84 TgCyr-1 (Smith et al 2004) CH4 emissions depend on: • Water table depth • Soil temperature • Substrate availability (approximated by NPP) • Thaw depth (when permafrost is present) Hydrology influences all of these
Wetland CH4 Emissions (Huissteden 2004)
Example: Finnish bog • Where water table is near surface: • aerobic respiration and methane oxidation rates are small • methane production is large • Where water table is deeper: • aerobic respiration and methane oxidation rates are large • methane production is small • At all locations, methane production rises and falls with soil temperature Walter and Heimann (2000)
Example: bog underlain by permafrost More substrate is made available for consumption as the thaw depth increases. This prolongs the period of CH4 production through September. Walter and Heimann (2000)
Example: West Siberian Peatlands • West Siberian peatlands: • Cover 600,000 km2 • Store 70 Gt (Pg) C (Sheng et al, 2004, Smith et al, 2004) • Permafrost is a factor here
Permafrost extent is shrinking • Future extent uncertain • Estimates depend on: • CO2 scenario • Climate model (Frey and Smith 2005)
Boreal wetland extent is changing • Depends on hydrological conditions: • Precipitation excess (P-E) • Permafrost extent • Northern Siberia: • continuous permafrost thaws • wetlands form • Southern Siberia: • discontinuous permafrost disappears • wetlands disappear (Smith et al 2005)
Potential Consequences One scenario: • West Siberian peatlands thaw completely and water table drops • Complete shutdown of CH4 emission • Complete oxidation of C over 500 years = flux to atm. of 140 TgCyr-1 (Smith et al 2004) • Without enhanced uptake by biosphere and oceans, growth rate of atm. [CO2] will increase by 0.07 ppm per year, 4% faster than current rate • Net decrease in greenhouse potential
Rivers • Transport carbon (DOC, DIC) to oceans: • 0.4-1.2 GtCyr-1 globally (Degens et al 1991) • Emit CO2 to atmosphere (evasion): • At least 1 GtCyr-1 (Richey et al 2002) • Majority comes from from respiration of particulate organic carbon (POC) within the river • Hydrology plays key role: • River surface area • POC donated by uplands during floods (Richey et al 2002)
Rivers: CO2 Evasion • Depends on: • Surface area of river network • POC content • Temperature • Currently more important in tropics than at high latitudes • Tropics: 0.9 GtCyr-1 (Richey et al 2002) • Northern Peatlands: 0.02-0.05 GtCyr-1 (Hope et al 2001) but this may be an underestimate Ob, Yenisei, Lena: 0.3-0.4 ton km-1 yr-1 Amazon: 2.9 ton km-1 yr-1 POC Yields (Beusen et al 2005)
Rivers: CO2 Evasion at high latitudes • Frey et al (2005): DOC transport from west Siberian peatlands to Arctic Ocean is likely to increase dramatically (29-46%) during next century, due to thawing of permafrost • This may increase evasion of CO2 at high latitudes
Terrestrial Carbon Uncertainties General Issues • Balance between increased NPP and increased Rh • Particularly boreal forests vs tropical forests • Shape of NPP response curve at high [CO2] – when does CO2 fertilization saturate? • Upper limits on C storage in ecosystems (mechanical and resource constraints) • Thawing of permafrost may decrease the available storage capacity at high latitudes • Future land-use changes • Changes in fire regimes • Changes in N cycle?
Terrestrial Carbon Uncertainties (cont.) Future wetland extent • Non-uniform increases in precipitation and evaporation over most of high latitudes • Where will precipitation excess (P-E) be higher? Lower? By how much? • Influence of topography, soil characteristics • How quickly will permafrost thaw, and where? High-latitude river evasion • How much organic C will be released as permafrost thaws? • How fast will it decompose in transit?
Terrestrial Carbon Uncertainties Competing influences of warmer T and drier soils on NPP, peat accumulation, CH4 emissions • Relative importance of cold T, permafrost, waterlogging, and substrate quality in stabilizing soil organic matter are poorly known (Hobbie et al 2000) • behaviors under climate change? • Contribution of wintertime soil respiration to C fluxes (Hobbie et al 2000) • appears substantial but magnitude is unknown • Influence of fire, permafrost, and drainage on large-scale C fluxes poorly known (Hobbie et al 2000) • Observations have been primarily at site level • Corradi et al (2005): global warming will increase the carbon sink of boreal wetlands • whether this will entail a reduction in methane emissions depends on whether higher T results in drier or wetter conditions • Angert et al (2005): drier summers produced by warming climate 1985-2002 canceled out the CO2 uptake enhancement induced by warmer springs How will changes in species assemblage affect rates of peat accumulation and decomposition? (Strack et al 2004, Bauer 2004) Effect of emission of methane by plants? (Keppler et al 2006)
Terrestrial Carbon Modeling Issues Dynamic global vegetation models (DGVMs) • Simulate biological processes based on soil and climate • Contain some soil hydrology formulation • Focus is on reproducing soil moisture trends • But best available observations are for stream flow • Vegetation distribution depends on: • Soil and climate • Growth rates • Competition for resources • Disturbance frequency (fire, mortality) • Take account of lagged response of veg to climate • Typically do not simulate methane emissions • Examples: HYBRID, IBIS, LPJ, SDGVM, TRIFFID, VECODE, BIOME3, DOLY • Reproduction of observed land surface water cycle dynamics is problematic
Terrestrial Carbon Modeling Issues (cont.) To adequately model water-mediated processes, carbon models need sophisticated soil hydrological components: • Hydraulics • Thermodynamics • Snow formulation • Realistic stream flow • Lakes/wetlands • Permafrost Most terrestrial carbon models handle these, but formulations are not sophisticated Ex: HYBRID, IBIS, LPJ, CASA, CENTURY Large-scale hydrology models handle these with varying success Ex: VIC, CLM, ECMWF Few large-scale models handle these Ex: VIC
Conclusions • Current separation of water and carbon communities is primarily an administrative artifact, which can only retard the scientific advances in both areas • Many examples of strong linkage between water and carbon cycle at high latitudes, and specifically within the NEESPI region • Makeup of NEESPI science team provides an opportunity to break down barriers between the two communities in a region where carbon/CH4 dynamics have strong implications for the global climate system
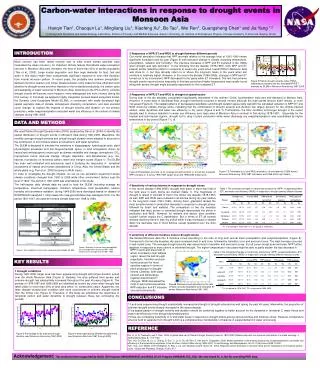
Diagnosis and Prognosis of Changes in Lake and Wetland Extent on the Regional Carbon Balance of Northern Eurasia PI: D.P. Lettenmaier (University of Washington Co-PIs: L.C. Bowling (Purdue University) K. McDonald (Jet Propulsion Laboratory) Collaborators: N. Speranskaya and K. Tysentko (State Hydrological Institute, Russia) Daniil Kozlov and Yury N. Bochkarev (Moscow State University) Reiner Schnur and Martin Heimann (Max Planck Institute for Biogeochemistry) Gianfranco De Grandi (Joint Research Centre, Italy)
Overarching Science Question: • How have changes in lake and wetland extent in northern Eurasia over the last half-century affected the region’s carbon balance, and how are changes in lakes and wetlands over the regional likely to affect its carbon balance over the next century? • Specific Questions • What areas within the region have been, and are most likely to be in the future, affected by changes in lake and wetland extent? • How are ongoing changes in the tundra region (especially changes in permafrost active layer depth) affecting the dynamics of wetlands, and how are and will these changes affect the carbon balance of the region? • How well can current sensors (MODIS, SAR) detect changes in wetland extent, and can high resolution SAR products be used to extend the rapid repeat cycle of lower resolution products like MODIS to provide information about seasonal and interannual variations in lake and wetland extent?
General approach: • Use high resolution remote sensing and in situ data to test and evaluate new lake and wetland, and permafrost dynamics models within the Variable Infiltration Capacity (VIC) macroscale hydrology model. • The VIC model will then be linked (through collaborations with ongoing work at MPI-Hamburg and Jena with a dynamic terrestrial carbon model, and with a lake and wetland methane model. • Evaluation will be performed with respect to large area estimates of carbon production and sequestration based on a combination of extrapolation of direct measurements, inverse modeling methods, and other modeling studies. • Finally, we will attempt to reconstruct, using the extended VIC construct, the time history of terrestrial carbon and methane balances over the arctic Eurasia drainage, and, using a range of climate scenarios, to interpret how these balances might change over the next century.
Tasks Task 1: Model improvements • Task 1a: VIC Lake and Wetlands model extensions • Task 1b: Methane model extensions • Task 1c: Integration of VIC in MPI VIC/BETHY/LPJ framework Task 2: Data preparation and analysis • Task 2a: In situ data • Task 2b: Satellite data Task 3: Model testing and evaluation Task 4: Retrospective reconstruction of regional carbon balance
BETHY/LPJ net primary productivity for the 1-degree grid cell centered at 60.5 N, 65.5 E, 1979 VIC daily average soil temperatures for the 100-km EASE grid cell centered at 60.6 N, 65.5 E, 1979 Simulated methane fluxes for the 100-km EASE grid cell centered at 60.6 N, 65.5 E, 1979.
Modeling: Recent Progress Better parameterizations of peat accumulation • Bauer (2004): changes in T, pH, water table over time Incorporate CH4 emissions in wetlands into large-scale framework • Walter et al (2001) • coupled Walter-Heimann methane model to simple large-scale hydrological model • hydrological model simplistic – didn’t handle snow, frozen soil, wetland evolution, etc. • Shindell et al (2004) estimated future global methane emissions by: • correlating simulated methane emissions (Walter-Heimann model) to simulated anomalies of soil moisture and precipitation (ECMWF) for period 1982-1993 • applying correlations to anomalies from GISS GCM double CO2 scenario • good first pass at predicting wetland extent, but ignores surface processes (especially permafrost dynamics)
Modeling: Recent Progress Combining hydrology and river chemistry • Seitzinger et al (2005), Beusen et al (2005) • Global Nutrient Export from Watersheds (GNEWS) • coupled carbon, chemistry and hydrologic models to estimate river transport of POC • Evasion? Permafrost, wetland dynamics, and large-scale carbon cycling • Zhuang et al (2001) • coupled 1D permafrost model to Terrestrial Ecosystem Model (TEM) • Joint Simulation of Biosphere Atmosphere Coupling in Hamburg (JSBACH) • coupled LPJ (carbon), ECHAM (climate), VIC (hydrology), BETHY (plant phenology) • Soon will add Walter-Heimann methane model
Pathways for CH4 to reach atmosphere • Diffusion • Slow • Always available • Many opportunities for oxidation when diffusing through aerobic soil • Ebullition • Rising of bubbles through water column • Fast • Occurs in saturated soil and in open water • Plant-aided transport • CH4 travels through aerenchyma (snorkel-like air tubes in wetland plant tissue) • Fast • Some opportunity for oxidation by microbes in vicinity of plant roots before CH4 reaches aerenchyma • Requires presence of vascular wetland plants • Requires that plant roots extend into saturated soil
Wetland Peat Accumulation Peat Accumulation Soil T NPP Permafrost pH Species Assemblage Leaching of DOC Water Table