Carbon – Nitrogen – Climate Coupling
Carbon – Nitrogen – Climate Coupling. Peter Thornton NCAR, CGD/TSS June 2006. The global carbon cycle: fluxes and storage. The global carbon cycle: fluxes and storage. The global C cycle: changes over time. The global C cycle: changes over time.

Carbon – Nitrogen – Climate Coupling
E N D
Presentation Transcript
Carbon – Nitrogen – Climate Coupling Peter Thornton NCAR, CGD/TSS June 2006
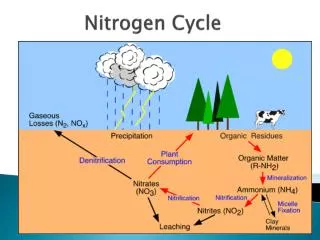
Carbon cycle Nitrogen cycle Atm CO2 Internal (fast) External (slow) nit/denit Plant N dep Respiration Litter / CWD Soil Mineral N N fix Soil Organic Matter N leaching
Elements of design • Establish design goals • Persistence in the pursuit of quality • Probe, test, explore… • …build prototypes, and be prepared to abandon them • Build to last, and archive your efforts
C-N coupling: hypotheses • N-limitation reduces land ecosystem response to increasing CO2 concentration • Reduced base state • Stoichiometric constraints, internal N cycling • Progressive N-limitation due to biomass accumulation • N-limitation damps carbon cycle sensitivity to temperature and precipitation variability • Reduced base state • Persistence due to internal N cycling
C-N coupling: hypotheses (cont.) • Climate x CO2 response • Changes over time in land carbon cycle sensitivity to variability in temperature and precipitation, forced by land carbon cycle response to increasing CO2.
Simulation protocol • Spinup at pre-industrial CO2 and N deposition • ~700 yrs, following Thornton and Rosenbloom (2005) • Drive CLM-CN with 25 years of hourly surface weather from coupled CAM / CLM-CN. • Transient experiments (1850-2100) • Increasing CO2 • Increasing N deposition • Increasing CO2 and N deposition • Repeat experiments in C-only mode • supplemental N addition, following Thornton and Zimmermann (in review)
GPP (CO2+Ndep) transient, control (transient-control) offline CLM-CN (CAM drivers) coupled (CAM – CLM-CN)
Land biosphere sensitivity to increasing atmospheric CO2 (L) CLM-C CLM-CN (CO2,Nfix,dep) CLM-CN (CO2,Nfix) CLM-CN (CO2) C4MIP models C4MIP mean Results from offline CLM-CN, driven with CAM climate, in carbon-only (CLM-C) and carbon-nitrogen (CLM-CN) mode, from present to 2100. Using SRES A2 scenario assumed CO2 concentrations.
Spatial distribution of L 2000 2100 C-N C-N C-only C-only
NEE sensitivity to Tair and Prcp (at steady-state) Coupling C-N cycles buffers the interannual variability of NEE due to variation in temperature and precipitation (global means, control simulations).
NEE sensitivity to Tair and Prcp (at steady-state) Tair Prcp C-N C-N C-only C-only
Components of NEE temperature response NPP NEE HR NPP dominates NEE response to temperature in most regions. Exceptions include Pacific Northwest, Scandanavia. FIRE
Dissection of NPP temperature response GPP NPP Btran Warmer temperatures lead to drying in warm soils (increased evaporative demand), and wetting in cold soils (less soil water held as ice). Soil ice
Components of NEE precipitation response NPP HR NEE NPP dominates NEE response to precipitation in tropics, midlatitudes, HR dominates in arctic and coldest climates. FIRE
Dissection of HR precipitation response HR Snow depth NEE Higher Precip in arctic/cold climate produces deeper snowpack, warmer soils, increased HR. Tsoil
NEE sensitivity to Tair and Prcp: effects of rising CO2 and anthropogenic N deposition Carbon-only model has increased sensitivity to Tair and Prcp under rising CO2. CLM-CN has decreased sensitivity to both Tair and Prcp, due to increasing N-limitation.
Conclusions (1) • C-N coupling significantly reduces L • not primarily the result of altered base state • strongest in the tropics and above 40N
Conclusions (2) • C-N coupling significantly reduces NEE sensitivity to interannual variation in Tair and Prcp at steady-state • Tair effect is not primarily due to altered base state • Prcp effect consistent with alteration to base state • Tair: NPP dominates, with warming leading to drying in warm soils, wetting in cold soils. • Prcp: NPP dominates in tropics/temperate, but HR dominates in cold climates, with wetting leading to deeper snow, warmer soil, increased HR. • Tair and Prcp responses likely in tension for warmer-wetter future climate.
Conclusions (3) • Increasing CO2amplifies the sensitivity of land carbon cycle to Tair and Prcp in C-only model, but damps these sensitivities in C-N model • This difference is not primarily due to a difference in base state. • Tair response is consistent with increasing N limitation under increasing CO2
The role of disturbance in C-N-climate coupling Wind damage
The role of disturbance in C-N-climate coupling Forest harvest
Simulated disturbance effects: Duke Forest, NC Harvest loss: 11278 gC m-2 Thornton, in prep.