Download

1 / 20
200 likes | 304 Views
Explore the impact of social responsibility screening on portfolio returns, the effectiveness of risk management strategies, and the use of optimization tools. Learn how to minimize tracking error and volatility while maintaining alignment with mainstream asset management practices.

E N D
MEASURING AND CONTROLLING YOUR INVESTMENT RISK Sandy Warrick Sept 2002 Northfield Information www.northinfo.com
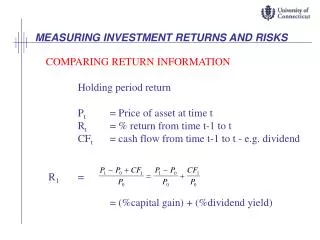
The Challenge Equity portfolios whose selection of securities is subject to social responsibility screening represent a restricted set of economic opportunity and produce different returns from portfolios composed of more broadly based market indices.
Literature • Luck (1993, 1998) finds half of the DSI’s outperformance since due to stock selection, which was, in turn, a function of the social screens. • This raises the possibility that there is a “social factor”, which affects returns. If so, this would need to be estimated and utilized in risk management of socially screened portfolios.
Literature, Continued • Numerous other studies, however, have failed to find such a factor. • Dhrymes (1998) tests 17 of factors in a widely used database of corporate social responsibility and finds “no perceptible and consistent differences in the (expected or mean) rates of return… between SR firms and entire universe”
Literature, Continued • Hamilton, Jo, and Statman (1993) find that the performance of screened and unscreened mutual funds is indistinguishable. • Kurtz, Lloyd and Dan diBartolomeo, “Socially Screened Portfolios: An Attribution Analysis of Relative Performance”, Journal of Investing, Fall 1996. • diBartolomeo, Dan and Kurtz, Lloyd, “Managing the Risk of Socially Screened Portfolios”, www.northinfo.com, 1999.
Literature Survey: Conclusions • There is strong empirical evidence that there is no systematic return factor distinguishing socially screened portfolios and typical investment universe. • Therefore, industry standard risk control models and optimization algorithms can be useful in managing socially screened portfolios.
What We Want to Show • That socially responsible portfolios are a very close proxy to conventional (S&P 500, Russell 1000) institutional asset management practice. • That portfolio optimization tools are useful at estimating and controlling the risk of socially responsible funds.
Factor Model Attribution Analysis of Domini Social Index Our first step was to run a performance attribution of the DSI 400 against the S&P 500 for the period May of 1992 through June 2002, using an endogenous factor model.
Results of Performance Attribution:1992 through 2002 (June) • Average Beta is 1.10 vs. 1.04 for S&P 500Note: Beta vs. Northfield’s Total Market Benchmark • Return to beta is 2 b.p. (±0.24) per month. • Return to industry exposure is 8 b.p. (±0.44) per month • Return to factor exposure is 0 b.p. (±0.41) per month • Return to stock specific risk is -2 b.p. (±0.59) per month • Realized tracking error is 3.25% per year. • Absolute annualized volatility of DSI Fund is 15% vs. 14.1% for S&P 500
Reweighting Using Fundamental Model • The reweighted portfolios were designed to mimic the behavior of the S&P 500 by matching the factor loadings of the revised DSI to factor loadings of the S&P 500 and to minimize stock specific (non factor) risk as much as possible. • The initial "optimized" DSI portfolio was constructed on December 31, 1992 and was rebalanced at the end of each month. • Rebalancing procedures involved no constraint on position sizes or number of securities. • Transaction costs were assumed at 2% per share, one-way.
Results of Performance Attribution:Reweighted Portfolio • Average Beta is 1.03 vs. 1.04 for S&P 500 • Return to beta is 0 b.p. (±0.06) per month. • Return to industry exposure is 4 b.p. (±0.28) per month • Return to factor exposure is -2 b.p. (±0.24) per month • Return to stock specific risk is +2 b.p. (±0.50) per month • Realized tracking error is 2.0% per year. • Absolute annualized volatility of DSI Fund is 13.6% vs. 14.1% for S&P 500
Conclusions • It is possible to reduce the tracking error of a socially screened portfolio to the level of an enhanced index fund (2% or so) using portfolio optimization. • Portfolio optimization does a good job at predicting the realized tracking error over the next year, assuming the portfolio is periodically rebalanced.