Download
1 / 42
430 likes | 610 Views
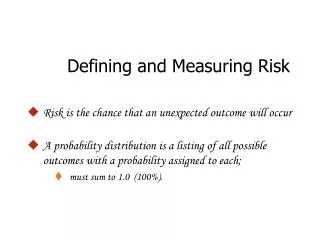
Defining and Measuring Risk. Risk is the chance that an unexpected outcome will occur A probability distribution is a listing of all possible outcomes with a probability assigned to each; must sum to 1.0 (100%). It either will rain, or it will not. Only two possible outcomes.

E N D
Defining and Measuring Risk • Risk is the chance that an unexpected outcome will occur • A probability distribution is a listing of all possible outcomes with a probability assigned to each; • must sum to 1.0 (100%).
It either will rain, or it will not.Only two possible outcomes. Probability Distributions
Martin Products and U. S. Electric Rate of Return on Stock if This State Occurs State of the Probability of This State Economy Occurring Martin Products U.S. Electric Boom 0.2 110% 20% Normal 0.5 22% 16% Recession 0.3 -60% 10% 1.0 Probability Distributions
Expected Rate of Return • Rate of return expected to be realized from an investment during its life • Mean value of the probability distribution of possible returns • Weighted average of the outcomes, where the weights are the probabilities
Martin Products U. S. Electric Probability of This State Return if This State Return if This State of the Product: Product: State Occurs (ki) Economy Occurring ( Pr ) Occurs (ki) (2) x (3) (2) x (5) i (1) (2) (3) = (4) (5) = (6) Boom 0.2 110% 22% 20% 4% Normal 0.5 22% 11% 16% 8% Recession 0.3 -60% -18% 10% 3% ^ ^ = = 1.0 k 15% k 15% m m Expected Rate of Return
Discrete Probability Distributions • Discrete Probability Distribution:number of possible outcomes is limited, or finite.
Continuous Probability Distributions • Continuous Probability Distribution:number of possible outcomes is unlimited, or infinite.
Probability Density U. S. Electric Martin Products -60 0 15 110 Rate of Return (%) Expected Rate of Return Continuous ProbabilityDistributions
Expected ^ ^ ^ Payoff ^ ^ ^ Return 2 2 ki - k Probability ^ (k - k) (k - k) Pr ^ i i i k k i (1) (2) (1) - (2) = (3) (4) (5) (4) x (5) = (6) 110% 15% 95 9,025 0.2 1,805.0 22% 15% 7 49 0.5 24.5 -60% 15% -75 5,625 0.3 1,687.5 Measuring Risk: The Standard Deviation Calculating Martin Products’ Standard Deviation
s Risk = = = Coefficient of variation CV Return ˆ k Measuring Risk: Coefficient of Variation • Standardized measure of risk per unit of return • Calculated as the standard deviation divided by the expected return • Useful where investments differ in risk and expected returns
Risk Aversion • Risk-averse investors require higher rates of return to invest in higher-risk securities
Risk Aversion and Required Returns • Risk Premium (RP): • The portion of the expected return that can be attributed to an investment’s risk beyond a riskless investment • The difference between the expected rate of return on a given risky asset and that on a less risky asset
Portfolio Risk and theCapital Asset Pricing Model • CAPM: • A model based on the proposition that any stock’s required rate of return is equal to the risk-free rate of return plus a risk premium, where risk is based on diversification. • Portfolio • A collection of investment securities
Portfolio Returns • The weighted average expected return on the stocks held in the portfolio • Expected return on a portfolio,
Portfolio Returns • Realized rate of return, k • The return that is actually earned • Actual return usually different from expected return
Stock W Stock M Portfolio WM 25 25 25 15 15 15 0 0 0 -10 -10 -10 Returns Distribution for Two Perfectly Negatively Correlated Stocks (r = -1.0) and for Portfolio WM:
Returns Distributions for Two Perfectly Positively Correlated Stocks (r = +1.0) and for Portfolio MM’: Stock M Stock MM’ Stock M’ 25 25 25 15 15 15 0 0 0 -10 -10 -10
Portfolio Risk • Correlation Coefficient, r • Measures the degree of relationship between two variables. • Perfectly correlated stocks have rates of return that move in the same direction. • Negatively correlated stocks have rates of return that move in opposite directions.
Portfolio Risk • Risk Reduction • Combining stocks that are not perfectly correlated will reduce the portfolio risk through diversification. • The riskiness of a portfolio is reduced as the number of stocks in the portfolio increases. • The smaller the positive correlation, the lower the risk.
Firm-Specific Risk versus Market Risk • Firm-Specific Risk: • That part of a security’s risk associated with random outcomes generated by events, or behaviors, specific to the firm. • Firm-specific risk can be eliminated through proper diversification.
Firm-Specific Risk versus Market Risk • Market Risk: • That part of a security’s risk that cannot be eliminated through diversification because it is associated with economic, or market factors that systematically affect all firms.
Firm-Specific Risk versus Market Risk • Relevant Risk: • The risk of a security that cannot be diversified away, or its market risk. • This reflects a security’s contribution to a portfolio’s total risk.
The Concept of Beta • Beta Coefficient, b: • A measure of the extent to which the returns on a given stock move with the stock market. • b = 0.5: Stock is only half as volatile, or risky, as the average stock. • b = 1.0: Stock has the same risk as the average risk. • b = 2.0: Stock is twice as risky as the average stock.
Portfolio Beta Coefficients • The beta of any set of securities is the weighted average of the individual securities’ betas
Market Risk Premium • RPM is the additional return over the risk-free rate needed to compensate investors for assuming an average amount of risk. • Assuming: • Treasury bonds yield = 6%, • Average stock required return = 14%, • Then the market risk premium is 8 percent: • RPM = kM - kRF = 14% - 6% = 8%.
Risk Premium for a Stock • Risk Premium for Stock j • = RPj = RPM x bj
The Required Rate of Return for a Stock • Security Market Line (SML): • The line that shows the relationship between risk as measured by beta and the required rate of return for individual securities.
Required Rate of Return (%) khigh = 22 kM = kA = 14 kLOW = 10 kRF = 6 Relatively Risky Stock’s Risk Premium: 16% Market (Average Stock) Risk Premium: 8% Safe Stock Risk Premium: 4% Risk-Free Rate: 6% 0 0.5 1.0 1.5 2.0 Risk, bj Security Market Line
The Impact of Inflation • kRF is the price of money to a riskless borrower. • The nominal rate consists of: • a real (inflation-free) rate of return, and • an inflation premium (IP). • An increase in expected inflation would increase the risk-free rate.
Changes in Risk Aversion • The slope of the SML reflects the extent to which investors are averse to risk. • An increase in risk aversion increases the risk premium and increases the slope.
Changes in a Stock’s Beta Coefficient • The Beta risk of a stock is affected by: • composition of its assets, • use of debt financing, • increased competition, and • expiration of patents. • Any change in the required return (from change in beta or in expected inflation) affects the stock price.
Stock Market Equilibrium • The condition under which the expected return on a security is just equal to its required return • Actual market price equals its intrinsic value as estimated by the marginal investor, leading to price stability
Changes in Equilibrium Stock Prices • Stock prices are not constant due to changes in: • Risk-free rate, kRF, • Market risk premium, kM – kRF, • Stock X’s beta coefficient, bx, • Stock X’s expected growth rate, gX, and • Changes in expected dividends, D0.
Physical AssetsVersus Securities • Riskiness of corporate assets is only relevant in terms of its effect on the stock’s risk.
Word of Caution • CAPM • Based on expected conditions • Only have historical data • As conditions change, future volatility may differ from past volatility • Estimates are subject to error