Download
1 / 8
90 likes | 242 Views
Learn the rules and procedures for comparing 2-component and 3-component systems through a triangular diagram experiment. Understand the constant ratio concept and miscibility curve calculations.

E N D
three component Systems Lab. 3 Done By: Assistant Lecturer ZeinaDawood Assistant Lecturer SuraZuhair Assistant Lecturer Hiba Sabah
the comparison between 2 component and three component system
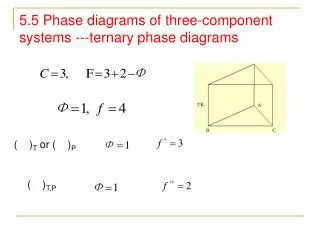
Rules relating to triangular diagram:- • 1)Each of the corners or apexes of triangle represent 100% by wt. of one component (A,B & C ) as a result , the same apex will represents 0% of the other two components • 2) The three lines joining the corner points represent two component mixture of the three possible combination of A,B &C . • 3) The area within the triangle represents all possible combinations of A,B&C to give three component system. • 4) If a line is drawn through any apex to a point on the opposite side ,then all systems represented by points on such line have constant ratio of two components . • 5) Any line drawn parallel to one side of the triangle represents ternary systems in which the proportion ( or % by wt)of one component is constant.
Procedure: • 1-Prepare 10 gm of the following combination of HAC & CHCl3:5%, 10%, 20%, 30%, 40%, 50%, 60%, 70%, 80%, and 90% w/w HAC:CHCl3 in a small clean &dry flask which form one single phase. • 2-To these mixtures slowly add water from a burette until a turbidity just appears. Check the weight of water (which is equal to its volume). • 3-Obtain a miscibility curve by calculating the percent w/w of each component in the turbid mixture and plot this triangular diagram. • Note:-To prepare samples in step no.1, the required amount of HAC&CHCl3 from burettes by converting the weight in to volume according to the law: • Specific gravity (sp.gr) = weight/volume • Sp.gr of HAC =1.009 and for CHCl3 =1.4
*Tabulated the amount of HAC ,CHCl3 and H2O *Calculate the % of each point, then drown the binodal curve which separate one phase from two phases area. * When the amount of HAC is low, the amount of water will be very low and when increase the mixture will separate into 2 phases.