Download
1 / 33
330 likes | 353 Views
Explore fundamental data structures for analyzing metabolic networks, enabling efficient graph algorithms, visualization, and user-defined criteria.

E N D
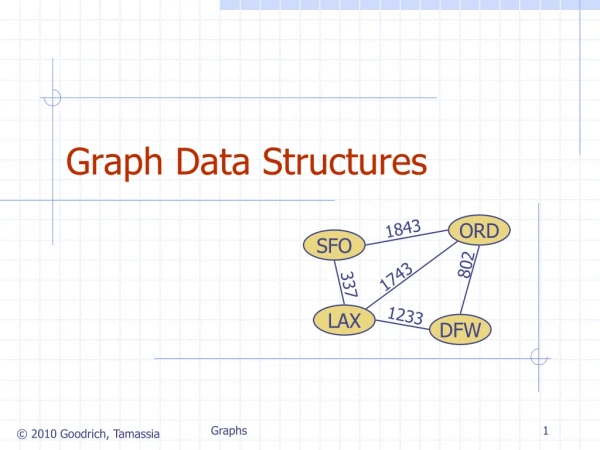
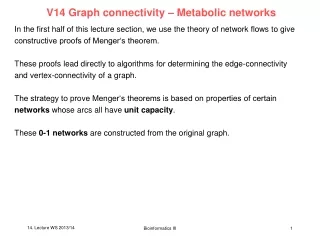
Basic Data Structures forGraph based Visualization and Analysis of Metabolic Networks Jan Griebsch & Arno Buchner & Hanjo Täubig Lehrstuhl für Effiziente Algorithmen Prof. E.W. Mayr Institut für Informatik, TU München BFAM Workshop16.-17.01.2004
Outline • Application Requirements • Related Work • Graph Concepts • Existing Software • Conclusions for Data Models • A Test Case
User-defined Requirement Profile • Work with (metabolic) networks including up to several 1000 nodes (reactions, substrates) • Store arbitrary context information for each node • Search for/filter/extract enzymes, metabolites, pathways/subnetworks according to user-defined criteria • Visualization of such networks • Support expand / contract meta-/nodes • Enable the use of graph algorithms efficiently • Accommodate abstractions such as clusters of nodes
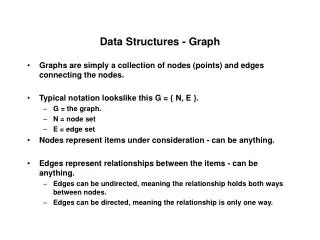
Compound Graphs Definition A compound graph C = (G,D) consists of a graph G = (V,EG) and a directed acyclic graph D=(V,ED) that share the same set of nodes. [Sugiyama and Misue 1991]
Clustered Graphs Definition A clustered graph C = (G, T) consists of a base graph G and a rooted tree T, such that the leaves of T are exactly the vertices of G. [Eades and Feng, 1996]
Graph Views Concept Definition Let G = (VG,EG) be the base graph. The hierarchy is defined by the tree T = (VT,ET), with the leaves L(T) = VG. A view is defined as a subset of VT that induces a partition of VG. [Buchsbaum and Westbrook 2000]
Existing Graph Software Software/Libraries • LEDA, Boost, GTL • no concept of hierarchies • Wilmascope, GVF • Clusters • no concept of views
Data + id : Integer + name : String <<constructor>> + Data (id: int) <<constructor>> + Data (id: int, name : String) <<getter>> + getID () : Integer <<setter>> + setName (name: String) : void GraphControl + id : Integer + name : String <<constructor>> : + Data (id: int) <<constructor>> : + Data (id: int, name: String) <<getter>> : + getID () : Integer <<setter>> : + setName (name: String) : void GraphElement + data : Data + redraw () : void + toString () : String GraphNode # edges : (Vector) <<constructor>> + GraphNode (data : Data ) <<getter>> + getEdgesIterator () : Iterator + addEdge (edge : Edge) : void + removeEdge (edge: Edge) : void Edge + startNode : GraphNode + endNode : GraphNode + directed : boolean = false <<constructor>> + Edge (data : Data) <<setter>> + setStartNode (node : GraphNode) : void <<setter>> + setEndNode (node : GraphNode) : void ClusterNode - members : Vector - internalEdges : Vector <<constructor>> ~ClusterNode (id : int) <<getter>> + getNodes () : Vector + containsNode : boolean + addNode (node : GraphNode) : void + removeNode (node : GraphNode) :void + addInternalEdge (edge : Edge) : void Graph # clusters : Vector # nodes : Vector # edges : Vector <<constructor>> + Graph () <<getter>> + getNodes () : Vector <<getter>> + getParentClusters (node : GraphNode) : Vector + containsNode : boolean + addNode (node : GraphNode) : void + removeNode (node : GraphNode) : void + addEdge (edge : Edge) : void + removeEdge (edge : Edge) : void + createCluster (clusteredNodes : Vector) : ClusterNode Graph Class DiagramExample: WilmaScope
GUI General User Interface Graph Visualisation Tools Moses (CCC Group) KEGG WIT BRENDA Biochemical Visualisation and Analysis Framework for Metabolic Networks (BVAM) Graph Graph Graph Analysis Tools Data Exchange Layer Datasources BioPath Database (CCC)
GraphElement # PropertyMap : HashMap + GraphElement() + add_attribute(keytype, valuetype) + remove_attribute(keytype) + has_attribute(keytype) : bool + get_value(keytype) : value Graph #adj : List<Edge> #nodes : List<Node> + Graph() + add_node(Node) + add_edge(Node, Node) + remove_node(Node) + remove_edge(Edge) Hierarchy + hierarchy(Graph&) + add_node(Node) + remove_node(Node) + father_edge() : Edge + son_edges() : edge_iterator + is_predecessor(Node, Node) : bool + induced_edge(Node, Node) : bool View + view(hierarchy&) + expand(node) + collapse(node) Class Diagram GraphElement Node Relation Edge Graph View Hierarchy
Class Diagram GraphElement How could arbitrary many hierarchies and views be modelled ? Node Relation Observer PatternView and Hierarchy are updated through callbacks [Raitner, 2003]. Edge Graph View Hierarchy
Class Diagram GraphElement Node Relation Edge Graph Observer + Observer(ObservedGraph&) + add_node_handler(Node)+ remove_node_handler(Node) + add_edge(Node, Node) + remove_edge(Edge) ObservedGraph+ ObservedGraph() + add(Observer&) + remove(Observer&) 1 1..* Hierarchy View
Space Time Trade-offs • Induced edges are calculated when needed • No redundant information • Expand/contract worst case: O(|EG|+ |VG|) • Quick edit operations on the base graph • Induced edges are stored[Buchsbaum and Westbrook, 2000] • Expand/contract in optimal time • Space required: O(|EG|D2) • Updates of the base graph are more complicated and need O(D2) expected time • Is there a good compromise ?
Example: Constructing Hierarchies on Metabolic Networks • Motivation • Explore properties of hierarchies on metabolic networks • Test prototype implementations • Study the question to what extend metabolic networks can be said to be composed of distinct sub- and sub-subnetworks (Betweenness centrality could also be used for detecting key reactions/enzymes) • Previous work • Large-scale organization of metabolic networks[Jeong et al., 2000] • The small world inside large metabolic networks[Fell and Wagner, 2001] • Exploring the pathway structure of metabolism[Schuster et al., 2002] • Subnetwork hierarchies of biochemical networks[Holme et al., 2002] • Hierarchical analysis of dependency in metabolic networks [Gagneur et al., 2003]
Example: Constructing Hierarchies on Metabolic Networks • Data • BioPath Database, Computer Chemie Centrum, Prof. Gasteiger • Decomposition • successively delete nodes according to a global centrality measure
Example: Constructing Hierarchies on Metabolic Networks • Deleted Metabolites Metabolite Betweeness PROTON (5.31227e+06) WATER (5.2434e+06) ATP (3.04506e+06) NAD (2.03219e+06) NADP (reduced) (2.26506e+06) COENZYME A (1.75499e+06) NADP (1.83248e+06) NAD (reduced) (2.23032e+06) PYROPHOSPHATE (2.04188e+06) ADP (2.08268e+06) CARBON DIOXIDE (1.89917e+06) PHOSPHATE (with GTP) (2.16805e+06) L-GLUTAMATE (1.78612e+06) ACETYL-COENZYME A (1.71162e+06) AMP (1.9995e+06) PYRUVATE (1.29878e+06) GLYCINE (1.31198e+06) AMMONIA (1.18789e+06) 2-OXOGLUTARATE (1.19791e+06) PHOSPHATE (protonated) (1.14856e+06) FAD (linked with enzyme) (1.2225e+06) OXALOACETATE (1.55343e+06) SUCCINYL-COENZYME A FORMATE L-SERINE L-METHIONINE UTP GLYCERALDEHYDE 3-PHOSPHATE UDP PALMITOYL-ENZYME Initial Graph: 3548 Nodes 8956 Edges
Screenshots Graph including all Biopath reactions (Random Layout with LEDA)
Screenshots Graph after deleting of 30 most central Metabolites (Spring embedded 3D Layout by LEDA)
Screenshot Graph with Data from Citrate-Cycle Random Layout, manually changed
Future Work • Implement graphical user interface • Include more data sources • Add chemical analysis abilities:Interact with MOSES, Prof. Gasteiger • Visualization
Thanks We want to thank Prof. E. W. Mayr, Dr. Jens Ernst, Klaus Holzapfel and Moritz Maass for ideas and discussion and Hanjo Täubig for practical support.
References [1] Buchsbaum, A. L. and Westbrook, J.R.. Maintaining Hierarchical Graph Views. 11th ACM-SIAM Symposium on Discrete Algorithms, 2000. [2] Eades, P. and Feng, Q.W. Multilevel Visualization of clustered graphs.Proc. Graph Drawing, LNCS, Vol. 1190, 101-112, Springer Verlag [3] Sugiyama, K. and Misue, K. Visualization of structural information: Automatic Drawing of Compound Digraphs.IEEE Trans. Systems, Man and Cybernetics, 21(4), 876-892. [4] Brandes, U. A Faster Algorithm for Betweenness Centrality. Journal of Mathematical Sociology, 25(2): 163-177, 2001 [5] Gagneur, J., Jackson, D. B. and Casari, G. Hierarchical analysis of dependency in metabolic networks. Bioinformatics, Vol. 19, 2003 [6] Schuster, S. , Pfeiffer, T., Moldenhauer, F., Koch, I. And Dandekar, T. Exploring the pathway structure of metabolism: decomposition into subnetworks and application to Mycloplasma pneumoniae [7] Holme, P., Huss, M. and Jeong, H. Subnetwork hierarchies of biochemical pathways [7] M. Raitner A Library for Hierarchies, Graphs and Views
Visualization using Hierarchies • Example taken from EcoCyc (http://ecocyc.org/) • Useful for getting overview • Limitations here: Only few levels and global change of detail-level
Analysis using Hierarchies Recent approaches: • Holme et al., 2002 • Detecting subnetwork hierarchies of biochemical networks using the betweeness centrality of reactions • Gagneur et al., 2003 • Analysis of hierarchical dependencies of subnetworks using connectivity ranking of metabolites • Schuster et al. , 2003 • Decomposition of the metabolic network using connectivity ranking for metabolites
Resulting Data model Bipartite hierarchical Graph • Bipartite node structure for different representation of reactions and metabolites • Specific information can be labelled to the respective graph element (and used for analysis and visualization) • Graph specific algorithms can be implemented for calculation (pathway searches, statistics) • Biological concepts (pathways, cell compartments) can be modelled and visualized using hierarchical structures • Hierarchical clustering approaches with different criteria can be used for automated network decomposition
Wrapper Datasource Wrapper Concept IDNameSet1, IDNameSet2, … “Tell_IDSets”
“Build( IDNameSet )” Wrapper Datasource Wrapper Concept Edgeset<IDValue1, IDValue2, IDName1,IDName2> : Set
Wrapper Datasource Wrapper Concept “Tell_PropertySet ( IDName )” PropertyName-Set
Wrapper Datasource Wrapper Concept Propertyset<IDValue, PropertyValue> : Set “Get_PropertySet( IDValueSet, PropertyName )”
Graph Concepts and Software • Definitions • Clustered Graphs, [Eades and Feng, 1996] • Compound Graphs, [Sugiyama and Misue 1991] • Hierarchical Graph Views, [Buchsbaum and Westbrook 2000] • Software/Libraries • LEDA • Boost • GTL • Wilmascope • GVF • HGV
Supported Graph Operations • Navigation/View • Expand a node • Contract nodes • Structure Base Graph • Insert a new edge between two nodes s,t • Delete an edge • Insert a new node • Delete a node Hierarchy • Insert a new step into the hierarchy • Remove a step from the hierarchy