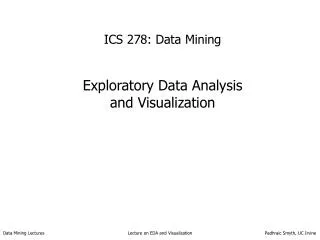
Data Visualization and Analysis
NeSSI. Data Visualization and Analysis. Ian Anderson Director, Experimental Facilities. October 13-15, 2003. The 2003 Nobel Prize in Physiology or Medicine. Paul C Lauterbur and Peter Mansfield for their discoveries concerning "magnetic resonance imaging“


Data Visualization and Analysis
E N D
Presentation Transcript
NeSSI Data Visualization and Analysis Ian Anderson Director, Experimental Facilities October 13-15, 2003
The 2003 Nobel Prize in Physiology or Medicine Paul C Lauterbur and Peter Mansfield for their discoveries concerning "magnetic resonance imaging“ In the beginning of the 1970s, they made seminal discoveries concerning the development of the technique to visualize different structures. These findings provided the basis for the development of magnetic resonance into a useful imaging method.
Harnessing the Power of Advanced Computing for Condensed Matter and Materials Physics, Chemistry, and Biosciences Office of Basic Energy Sciences Vortices in a superfluid Semiconductor-liquid interface C-H bond activation reaction Combustion turbulence modeling Cs ion transport Atomic hydrogen ionization Waveguide optics Two spheres mixing in a stream Crystal structure for C36 solid Magnetic moments in materials Gold nanowire Binary alloy solidification Clay-mineral geochemistry Complex fluids Nanoparticles binding in solution Na counterion mobility in DNA 3 Dissociation of ketene Solvation in supercritical water Turbulent flame Uranyl in aqueous solution Electric field in a 2D photonic crystal waveguide
Software enables science • Instrument control • Data • formats • storage • accessibility • ownership • Visualization • Treatment • Analysis • Complementarity • Simulation • Modeling • Make neutrons a simple tool • Cater for amateurs and pro’s • Extract relevant information • Optimize experiments • tanalysis < texperiment • Present methods are outdated • Software is often written by non- professionals • Resources are always limited
What has changed? • High speed computing • High speed networks • Massive data storage • NSSA survey (Roger Pynn) • Standardized collaborative data visualization and analysis • DOE OS report • Deployment of software to link geographically separated researchers, to facilitate movement of large (petabyte) data sets • NSF S&E report • 1st priority – advanced cyberstructure – better storage, analysis, visualization and distribution tools. Distributed computing
How to accomplish the Vision? • At SNS/HFIR we have been concentrating so far on building the data acquisition software. • The large BES software grant to Caltech (ARCS) has allowed them to start the development of an architecture (DANSE) which could be used throughout SNS and HFIR. • Interest from other facilities and user groups to participate • SNS must take the lead in defining the software to be used at SNS • Have to focus the efforts at Oak Ridge! • Short Term: Need to have software running in 3 years time • Develop the architecture • Incorporate legacy software • Long term: Develop the full capability with new software • Participation of other facilities and users
What has been happening? • Created a position at SNS for a task leader • Discussions with BES in July • Very supportive of the initiative • Want to see the impact on day 1 !! • Asked for a detailed plan/proposal • Asked SNS to review the DANSE proposal • Workshop to define requirements – NeSSI (13-15 March) • Visualization tools • Modelling • Distributed Analysis • Optimization of Experiments • Data Access • Networking Not discussing remote control of instruments!