Download
1 / 30
300 likes | 481 Views
Test procedures for ALICE Silicon Pixel Detector ladders. Alberto Pulvirenti University & INFN Catania 8th International Conference on Large Scale Applications and Radiation Hardness of Semiconductor Detectors Florence, 27-29 June 2007. http://www.cern.ch. LHC. ~ 9 km. SPS. CERN.

E N D
Test procedures for ALICE Silicon Pixel Detector ladders Alberto Pulvirenti University & INFN Catania 8th International Conference on Large Scale Applications and Radiation Hardness of Semiconductor Detectors Florence, 27-29 June 2007
http://www.cern.ch LHC ~9 km SPS CERN Large Hadron Collider
5.5 A TeV Pb-Pb Expected multiplicity (dNch/dy)y=0: Major uncertainties not completely resolved Still no safe way to extrapolate Simple scaling form RHIC ~2500 Safe guess ~1500 – 6000 Worst case ~8000 Baseline in the project Luminosity for Pb-Pb: Lmax = 11027 cm-2s-1 Some numbers related to ALICE and LHC worst (confusion) seen up to now: STAR …and the worst case for ALICE
HMPID PID (RICH) at very high pt TOF PID TRD Electron identification PMD g multiplicity TPC Tracking, dE/dx ITS Small pt tracking, parameter refinement at vertex Vertexing MUON-Arm m-pairs PHOS g,p0 The ALICE detector
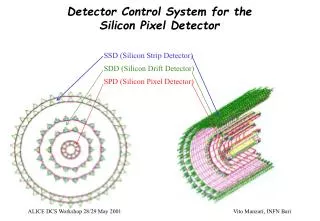
SSD SDD SPD Inner Tracking System (ITS) Lout=97.6 cm Rout=43.6 cm • 6 Layer, 3 technologies (occupancy ~2% at max multiplicity) • Silicon Pixels (0.2 m2, 9.8 Mchannels. Single chip size = 50x425 μm) • Silicon Drift (1.3 m2, 133 kchannels) • Double-sided Strip (4.9 m2, 2.6 Mchannels)
Silicon Pixel Detectors • ASIC Chip (150 µm thick): • 8192 pixels (256 columns * 32 rows) • sensitive area: 13.6 mm x 12.8 mm • Silicon sensor (200 µm thick) • size: 70.7 mm x 16.8 mm • Elementary assembly: the “Ladder” • = 1 Si sensor bump-bonded to 5 chip cells
ITS purposes • Track propagation to the closest distance from the interaction point • Best resolution for all track parameters • Tracking of low transverse momentum particles Main SPD contributions: • Primary vertex estimation before tracking (and used as a constraint for primary particles tracking) • Event multiplicity evaluation • Secondary vertices detection • D, B • strangeness
SPD test: work sequence • Step 1: waferprobing • chips are produced in “wafers” = blocks of 86 chips each • each chip is tested singularly • chips which fail tests are discarded for successive production • Step 2: ladder testing • ladders are mounted and their performances are tested again, and also a test is added to the detector response • when at last a chip is not good, the ladder can be reworked (bad chip is removed and replaced) • when too many chips are not good, the ladder is rejected
Chips: Class I – “good” used to build ladders Class II – “not too bad” used for tests Class III – “bad” rejected Ladders: Class I: “good” used to mount half-staves When: all class I chips Class II: “not too bad” reworked to be re-tested used for test When: at least one class 2 chip Class III: “bad” if just 1 bad chip rework If too many bad chips reject When: at least one class 3 chip SPD test: evaluation criteria
Chip test sequence (I) • Test of currents in the chip: • too high values can damage the chip (or the testing apparatus) or cause the chip not to work properly • Test protocol: threshold values for maximum allowed currents • If I_analog > max or I_digital > max CLASS 3 • Test of JTAG: • JTAG is fundamental for the dialog between the chip and the computer which must control it and read data from it • if JTAG test fails CLASS 3
Bad DAC curve Good DAC curve Chip test sequence (II) • Test of digital-to-analog converters (DAC) • DAC are fundamentals both for setting working parameters of chips and to read signals from them • Requirement: the conversion DAC curve must be smooth • if at least one DAC curve is not smooth CLASS 3 • Minimum threshold search: • Requirement: a value must be found for which NO pixels fire due to electronic noise only • if at least one pixel cannot be switched off (by lowering the threshold or masking that pixel), and then no minimum threshold is found CLASS 3
Chip test sequence (III) • Pixel matrix test • for 100 times, a MIP-like signal is sent to each pixel, when the whole chip is set to the minimum threshold value found before • Requirement: all pixels must respond to this signal almost always (~100 times). • if more than 1% (=82) pixel are underefficient or overefficient CLASS 2 • Threshold scan: • a signal is sent to the chip, which is lowered step by step from MIP value (60mV) to zero: at each step, the number of responding pixels is counted • Requirement: responding pixel distribution as a function of signal value must have a mean value not larger than a fixed threshold (30 mV in the waferprobing step, 60 mV in the ladder testing step) • if the mean of threshold distribution is > max CLASS 2
Chip test sequence (IV) • Fast-OR minimum threshold • Fast-OR signal is generated by the chip when at least one chip responds. • It can be used as a trigger during data acquisition. • Requirement: a threshold value must be found for which the pixel does not return a FO signal in absence of signal (i.e. due to noise) • if no FO minimum threshold is found CLASS 3 Average required time for a complete chip test: 10 min.
Detector test sequence • Leakage current • Requirement: not larger than a threshold value (1 mA) when applyng standard bias • if leakage current is too large CLASS 2 • Detector response: • the detector is exposed to a 37 MBq 90Sr source • Requirement: 1% maximum pixel defects (dead or noisy) • if there are > 1% dead/noisy pixels or entire dead/noisy columns CLASS 2 • if there is are too many dead/noisy pixels or dead/noisy zones in the matrix CLASS 3 • Visual inspection of the detector surface: • required to detect surface defects, holes, deep scratches which could cause the detector not to work properly • if defects are absent/negligible CLASS 1 • If defects are serious (deep holes or scratches) CLASS 3 not reworkable Average time requirement for a complete ladder test: 3.5 hours
Test apparatus VME Crate Lab Tests J1 Pilot card Card to manage Fast-OR trigger JTAG controller MB card (chip control) Cable to get Fast-OR signal
Suppor for tested device “chuck” Probe card with needles which create the contact with the tested chip Probe station trace left by previous contact (re-testing)
Probe card • 103 microneedles, divided in 3 groups • same needle spacing as chip pads one • common ground (LEMO cable)
Clean room in Catania Probestation with microscope MB card Power Supply
240 ladders tested: 151 (= 62.9%) class 1 23 (= 9.6%) class 2 66 (= 27.5%) class 3 Class 3 Class 1 Class 2 Ladder tests in Catania: summary from November 2005 up to now
Statistics Average number of defects per chip position: Class I ladders Chip 1 2 3 4 5 Defects 5 4 8 7 6 Chip Chip Chip Chip Chip 5 4 3 2 1 Ladder
Average min. threshold & noise Threshold (mV) • Avg. Threshold: • 41.1 ± 0.5 mV ~ 2400 e- • Avg. Noise: • 2.45 ± 0.03 mV ~140 e- • Good S/N ratio • Efficiency ~1 at experimental phase Noise (mV) • Chips with avg. noise > 2.8 mV • → 100 readout chips • 82 from production lots #7 and #8 • avg. Noise = 3.15 ± 0.03 mV • → systematic effect due to production process • (source: Carmelo Digiglio – INFN Bari)
Entries 533 Mean 16.49 RMS 21.36 Underflow 0 Overflow 35 Entries 533 Mean 33.48 RMS 25.66 Underflow 0 Overflow 126 Dead pixels Dead pixels in pulse test (chip alone) Dead pixels in source test (chip + sensor) A pixel is “dead” when it does not respond to impulses given by pulse or source defects in pixel response defect in pixel response OR faulty bump-bonds
Noisy pixels Entries 533 Mean 0.74 RMS 0.95 Underflow 0 Overflow 0 106 trigger signals sent during test phase noisy pixels → #hits > 104 (1% of #triggers) 94% sample → 1 noisy pixel = 0.1‰ of total Max number of noisy pixels in a single chip = 7 (0.08% of the total)
Class I Ladders Production 100%=240 Ladders 240 200 75%=180 Ladders 160 50%=120 Ladders 120 80 40 0 Nov-05 Dec-05 Jan-06 Feb-06 Mar-06 Apr-06 May-06 Jun-06 Jul-06 Aug-06 Ladder production
Summary • SPD is a fundamental module for several purposes in ALICE event reconstruction. • Building SPD requires an accurate testing procedure of each of its single components (ladders/chips), and for several aspects: • performances • defects • working parameters • PC – to – device communication • Catania’s group has given a large contribution to this testing activity, since 2004 up to the end of production required for SPD commissioning (first half of 2007). • Future plans: • tests for spare modules • looking forward to start using them with LHC beam! • Thanks to Carmelo Digildo for contributions to the statistics plots