Download
1 / 15
150 likes | 171 Views
This workshop focuses on the dynamical and microphysical evolution of convective storms, specifically the evaluation of cloud structure and precipitation in high-resolution Met Office models. Topics include nowcasting, data assimilation, cloud physics, and convection parameterization.

E N D
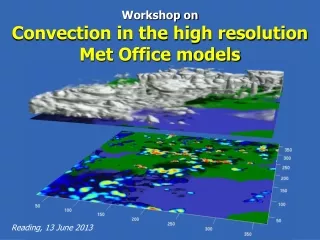
Workshop onConvection in the high resolution Met Office models Reading, 13 June 2013
Timetable 10.00 Arrival and coffee 10.15 Robin Hogan: Introduction and DYMECS update 10.30 Thorwald Stein: Evaluation of 3D cloud structure from DYMECS 10.45 Lee Hawkness-Smith: Nowcasting and data assimilation 11.00 Andrew Barrett: Convection over orography 11.15 Marion Mittermaier: Verification of precipitation 11.30 Paul Field/Jonathan Wilkinson: Cloud physics 11.45 Chris Holloway: Organisation of convection 12.00 Alison Stirling: Parameterization of convection 12.15 Pete Clark: Idealised simulations 12.30 Lunch 13.30 Discussion groups 14.45 Tea break 15.00 Summary of discussion 15.55 Close Please keep to time! 10-12 minute talks and 3-5 minutes for questions/discussion
Dynamical and microphysical evolution of convective storms (DYMECS) Derive structure of hundreds of storms on 40 days Evaluate the structure of clouds in the model Track storms in real time and automatically scan Chilbolton radar Operational radar network Robin Hogan, John Nicol, Kirsty Hanley, Thorwald Stein, Bob Plant, Humphrey Lean, Carol Halliwell
How well do the high-resolution models simulate surface rainfall? • Operational Met Office radar estimates surface rainfall every 5 minutes Radar 1.5-km model 200-m model
Performance on 25 August 2012 • 200-m model predicts number of small storms best • 1.5-km model underestimates small storms but is much better at large storms • 200-m model predicts best average rainfall • But all models underestimate rainfall in the afternoon Radar 200-m model 1.5-km model Kirsty Hanley
Mixing length plays key role in determining number of small storms Enables 200-m model (with too many small storms) to behave more like observations, or a lower resolution model But optimum mixing length varies from case to case What controls the number of large storms? Storm distributions with mixing length 500-m model 1.5-km model Kirsty Hanley
Use radar radial wind and continuity equation, setting tangential convergence in each column to a constant such that we have zero vertical wind at ground and cloud-top Tests on slices through model implies errors of ±2 m s-1 Estimating updraft magnitude and scale from radar RHI scans
Distribution of vertical velocity from 500 m model • Retrieval good, although peak updrafts underestimated • In evaluating models statistically, we can either • Use a mapping function derived from model to correct tail • Compare retrievals to the same method applied in the model True Retrieved John Nicol
Evaluation of magnitude of updrafts Radar 500-m model • Agreement in terms of distribution is amazingly good!!! True model versus “mapped” observations Retrieval applied to model and observations John Nicol
Height distribution in several models • Mean updraft speed (w > 1 m/s) versus altitude Mapped retrieval 200-m model 500-m model 1.5-km model (dashed: with graupel) John Nicol
Evaluation of width of updrafts Retrieval in both observations and model: wmin=0.5 m/s; wmax>3.0m/s True model versus mapped observations: wmin=1.0 m/s; wmax>5.0m/s • Model updrafts shrink with resolution • 200-m model has about the right width • Does 100-m model shrink further or stay the same? • How does Smagorinsky mixing length affect model? Observations 200-m model 500-m model 1.5-km model
Discussion points • DYMECS takes a statistical approach, CSIP and COPE a case study approach; how can we best exploit the advantages of each? • What controls updraft scale and magnitude, in models and reality? • How can we evaluate convective organisation of storms in models? • Organisation unaffected by model settings tried: how to improve it? • Can models distinguish single cells, multi-cell storms, squall lines & quasi-stationary storms? Can we evaluate this from observations? • What is next frontier in evaluating storm-resolving models? Hail occurrence? Turbulence intensity? Lightning location? • What is the next frontier in improving storm-resolving models? Stochastic backscatter? Aerosol-cloud interactions? TKE schemes? • Can we use DYMECS-type observations to diagnose parameters that should be used in convection parametrizations? • What collaborative proposals should be written? What further observations are needed (post-COPE)?
At each height bin (1-km depth), derive mapping function (black) from 1D estimate (red) to truth (blue)
dBZ w