Download
1 / 24
240 likes | 398 Views
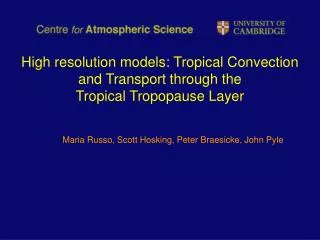
High resolution models: Tropical Convection and Transport through the Tropical Tropopause Layer. Maria Russo, Scott Hosking, Peter Braesicke, John Pyle. TROPICS. (K). P (hPa). Height km. 17. 380. 90. Cold point Tropopause. 15. 360. 130. Q=0. TTL. 12. 350. 200.

E N D
High resolution models: Tropical Convection and Transport through the Tropical Tropopause Layer Maria Russo, Scott Hosking, Peter Braesicke, John Pyle
TROPICS (K) P (hPa) Height km 17 380 90 Cold point Tropopause 15 360 130 Q=0 TTL 12 350 200 Lapse rate minimum 10 340 280 Less active convective region Active convective region Convection and the Tropical Tropopause Layer (TTL) Picture based on Gettelman and Forster, 2002
Troposphere-Stratosphere transport: what do we know? • Processes responsible for Troposphere-Stratosphere Transport: • Direct injection by convection penetrating into the lower stratosphere • Mixing in UTLS due to the breaking of convectively generated gravity waves • Slow radiative ascent above Q=0 level • Isoentropic transport from TTL to extra tropical lower stratosphere • These processes have different timescales: their relative contribution to the stratospheric composition will vary for species with different lifetimes.
Troposphere-Stratosphere transport: what do we know? Newell & Gould-Stuart,1981: ‘Stratospheric fountain’ hypothesis (preferential entry into the stratosphere at specific times and places characterised by lowest CPT temperatures, e.g. West Pacific) Gettelman et al., 2002; Liu and Zipser, 2005; Rossow and Pearl, 2007: frequency of convection penetrating the stratosphere is estimated from satellite data to be low (~0.5-1% of total number of storms) Gettelman et al., 2004: detailed study of radiative heating rate (Q). Q=0 level found ~15km, 3km above convective outflow and 2km below CPT Bonazzola & Haynes, 2003; Flueglistaler et al. 2005: air enters the TTL over West Pacific, is dehydrated, and subsequently moved by fast horizontal transport into extra tropical lower stratosphere Ricaud et al., 2007: impact of convection found in satellite trace gas distributions up to ~16-17km
Scientific Objectives • Identify seasonal/regional preferences for air entering the stratosphere • Estimate the relative contribution of convective transport vs large scale transport in determining the composition of the lower stratosphere • Simulate transport of short-lived ( ~1-3weeks) halogenated hydrocarbons (bromoform, methyl iodide); biogenic emissions from tropical shallow waters. • Investigate the ability of convective parametrization in models (e.g. UM) to give a reasonable representation of convective transport of water and trace gases. Effect of model resolution on convective transort. Tools • Global UM at various resolutions (N216, N96) • Mesoscale UM, relocated to tropical domains (Australia) at various resolutions down to convective permitting simulations (~1kmx1km)
Recent Tropical Campaigns: SCOUT-O3: Nov-Dec ’05 (Darwin, Australia) HIBISCUS:Feb ’05 (Bauru, S. America) SCOUT-AMMA:Jul-Aug ’06 (West Africa) ACTIVE:Nov’05-Feb’06 (Darwin, Australia)
Model Setup • N216 L38 (~60km): 1 month global run for November 2005 • Physics setup based on UKMO operational forecast • Initial conditions from UKMO data-assimilated dump for Nov’05 • Forced by climatological, SST & sea ice • Ozone, soil moisture and soil temperature constrained by climatological values • Added idealised tracer with different source regions, and exponential decay rates.
Tropical Convection: comparison with satellite Nov’05: Outgoing Longwave Radiation (OLR) UM montly mean OLR NOA monthly mean OLR
Tropical Convection: comparison with satellite Nov ’05: Total Precipitation Rate Model Satellite UM montly mean precip. rate CMAP monthly mean precip. rate
Tropical Convection penetrating Q=0 level Monthly mean convective cloud top height % of days with CCT penetrating Q=0
Tracer transport by tropical convection Monthly mean surface tracer, τ=6h Monthly mean model OLR
Tracer transport by tropical convection Timeseries, surface tracer, τ=6h
Tracer transport by tropical convection Monthly mean surface tracer, infinite lifetime Tracer with convective transport Tracer with no convective transport
Water vertical distribution in the UTLS TOTAL WATER FROM ‘FISH’ INSTRUMENT FISH data from SCOUT-O3
Summary • We setup and run the UM (N216 L38) for 1 month (Nov ’05) • A number of tracers with different lifetimes and source regions have been included in the simulation to investigate convective transport to the UTLS • The location and intensity of tropical convection in the model compares well with satellite data when averaged over a month • We are investigating the effect of convective transport on idealised tracers and water. This has implication for chemistry climate models and climate runs. • Model simulations suggest that short lived species can be transported above the Q=0 level within a day.
Further work • Run for other months (August 2006 – AMMA period) • Analysis of convection and convective transport at other resolutions: lower (N96L38 global), higher (~12km mesoscale) • Validate the model against campaign data • Identify regional preferences for air entering the TTL and lower stratosphere (tracers budgets) • Estimate the relative contribution of convection and large scale transport in determining the composition of the TTL and lower stratosphere
Unified Model details: UK Met Office Unified Model version 6.1 • Non hydrostatic model with hybrid (height) vertical coordinate. • Charney-Philips grid-staggering in the vertical, Arakawa C-grid staggering in the horizontal. • Edwards-Slingo radiation scheme with non-spherical ice spectral files. • CAPE closure convection scheme, including tracer and momentum transports and convective anvils. • Parametrized entrainment and detrainment rates for shallow convection (Grant and Brown, 1999). • Large-scale precipitation scheme by Wilson and Ballard, 1999). • The MOSES (Met Office Surface Exchange Scheme) surface hydrology and soil model scheme (Cox et al., 1999).
Monthly mean OLR CGAM current Climate for Nov ‘05 UM 1 month global run constrained by Nov climatological SST and sea ice NOA monthly mean satellite OLR for Nov ‘05
Monthly mean precipitation CGAM current Climate for Nov ’05 UM 1 month global run constrained by Nov climatological SST and sea ice CMAP precipitation for Nov ‘05
12km MODEL 60km MODEL Convective cloud top height (km)
Overview of the TTL and possible mechanisms for troposphere-stratosphere exchange Overworld ELS ELS Picture courtesy of James Levine (modified from Holton et al. 1995)