Download
1 / 21
210 likes | 384 Views
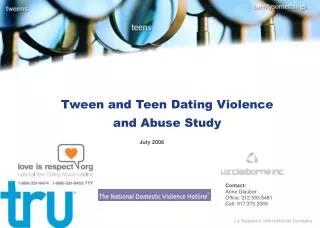
ANALYZING AND INTERPRETING DATA FROM THE REVISED CONFLICT TACTICS SCALES AND THE INTERNATIONAL DATING VIOLENCE STUDY Murray A. Straus Family Research Laboratory, University of New Hampshire Durham, NH 03824 603-862-2594 murray.straus@unh.edu

E N D
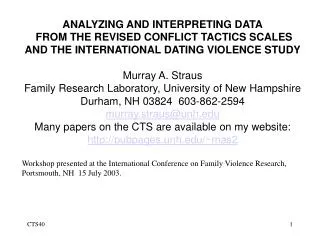
ANALYZING AND INTERPRETING DATA FROM THE REVISED CONFLICT TACTICS SCALES AND THE INTERNATIONAL DATING VIOLENCE STUDY Murray A. Straus Family Research Laboratory, University of New Hampshire Durham, NH 03824 603-862-2594 murray.straus@unh.edu Many papers on the CTS are available on my website: http://pubpages.unh.edu/~mas2 Workshop presented at the International Conference on Family Violence Research, Portsmouth, NH 15 July 2003.
TOPICS COVERED 1. The multiplicity of CTS scales and scores and how to manage them2.When to use the Frequency, Chronicity, Prevalence, and Ever Prevalence scores3. How to take into account severity of assault, injury etc4. Explanation of tables from a paper comparing Juarez Mexico and New Hampshire, USA5. Explanation of tables from a paper on the hypothesis that corporal punishment is related to violence against a dating partner
THE FIVE CTS2 SCALES * Physical Assault * Injury * Sexual Coercion * Psychological Aggression * Negotiation Each as subscales for “severe” and “minor” (less severe) levels
FOUR WAYS OF SCORING EACH CTS SCALE Prevalence (short for “annual prevalence”) One or more occurrences of any of the acts in the scale Score range 0 - 1 Frequency The number or occurrences of the acts in a CTS scale Score range 0 - (25* the number of items in the scale). For a six item scale this would be 0-150 Meaning of a score of 12 or 25 Chronicity The number of occurrences of the acts in a CTS scale by a partner who has done at least one of the acts Meaning of a score of 6, 12, or25 Ever Prevalence One or more occurrences of any of the acts in the scale since the relationship began Usually best to avoid because of memory problems
DON’T LET THE EXTENSIVE DATA FROM THE CTS2TEMPT YOU TO WRITE AN ARTICLE THAT IS UNDIGESTIABLE BECAUSE IT HAS TOO MUCH IN IT • 5 SCALES, EACH WITH 2 OR MORE SUBSCALES, AND BOTH VICTIMIZATION AND PERPETRATION DATA • = 5 * 2 * 2 = 20 variables • If you include the prevalence rate AND the chronicity for each scale: • = 20 * 2 = 40 variables • It is almost always important to present results for males and females separately, which further multiples the amount of information in an article • TWO STRATEGIES • Restrict the paper to either perpetration or victimization unless you have an important reason to compare them • Write separate papers for each of the scales unless you want to compare scores on two scales, or you have some other important reason to include two or more
ISSUES BEST INVESTIGATED WITH EACH OF THE FOUR SCORES • PREVALENCE • What percent of perpetrated or were victimized? (can also be a rate per 1,000, 10,000 etc) • * Among groups in your study such as young and old, treatment & control • * In your sample compared with other populations • FREQUENCY • How often did the behavior occur in the past year? (or whatever referent period was used) • * Not appropriate with general population samples because the mean and even the median is misleading. • * Appropriate with batterer treatment participants or victim samples CHRONICITY • In a general population, among the sub-set who manifest the behavior, how often did it occur? • EVER PREVALENCE • If the behavior did not occur in the past year, was there victimization or perpetration before that?
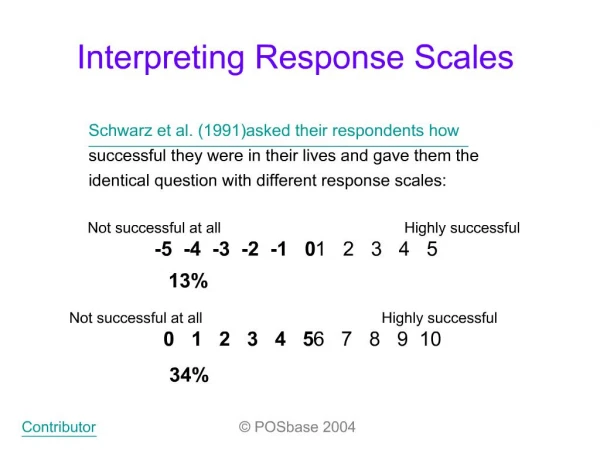
WHY PREVALENCE IS THE MOST FREQUENTLY USED SCORE • Everyone understands a percentage • Makes for easy comparison of subgroups • Does no exacerbate the skewed distribution and outlier problem • Can be used with logistic regression to obtain odds ratios and predicted probabilities • Even when other scores are presented, it is wise to also present the prevalence rates. It lets readers know where your population is.
HOW TO TAKE INTO ACCOUNT SEVERITY OF ASSAULT, INJURY, SEXUAL COERCION, AND PSYCHOLOGICAL AGGRESSION • USE THE SEVERE SUBSCALE • (For Sexual Coercion, the Threat and Force subscales) • * USE THE FREQUENCY OR CHRONICITY SCORE • Measures severity by how often the behavior occurs • * COMPUTE A “SEVERITY WEIGHTED” FREQUENCY OR CHRONICITY SCORE • BUT: In a general population sample, exacerbate skewness and outlier problems • Useful for issues such as measuring change in severity of perpetration or victimization • USE SEVERITY-LEVEL CATEGORIES • 0 = None, 1 = Minor Only, 2 = Severe • Can be the dependent variable in multinomial logistic regression. This gives separate coefficients for Minor Only and for Severe • My current recommendation
MODES OF ANALYSIS FREQUENCY DISTRIBUTION CROSS TAB ANOVA AND ANCOVA REGRESSION OLS ROBUST LOGISTIC – BINARY AND MULTINOMIAL FACTOR ANALYSIS GENDER SPECIFIC ANALYSE MULTILEVEL MODELING
TABLE FROM A PAPER ON VIOLENCE AGAINST DATING PARTNERS BY UNIVERSITY STUDENTS IN JUAREZ MEXICOIgnacio Luis RamirezTexas Technological Universiy STATISTICAL METHODS USED TO CREATE THE TABLES INTERPRETING THE TABLES
EXAMPLE OF TOO MUCH IN ONE ARTICLE
Two scales is probably as much as should be in one paper because it is usually important to give separate results for: Severe level (not in the above table) Both Prevalence and Chronicity (as above) INTERPRETATION OF DATA IN THIS TABLE
TABLES FROM A PAPER ON THE HYPOTHESIS THAT CORPORAL PUNISHMENT IS RELATED TO VIOLENCE AGAINST A DATING PARTNEREmily Douglas and Murray A. StrausUniversity of New Hampshire • WILL DISCUSS • STATISTICAL METHODS USED TO CREATE THE TABLES • INTERPRETING THE TABLES
CTS Rates These are CTS prevalence rates * Gender differences can be tested using cross tabs and chi-square. * Using ANOVA or ANCOVA lets you control for other variables and test for interactions, but with a dichotomous dependent variable, it violates the assumptions.
Figure 4. SEVERE INJURY OF DATING PARTNER BY CORPORAL PUNISHMENT AS A CHILD AND GENDER OF STUDENT • ANALYSIS OF COVARIANCE • DEPENDENT VARIABLE • CTS Injury Prevalence, coded 0-100 • INDEPDENDENT VARIABLES • Corporal punishment before age 12 • Gender of student • INTERACTION • Corporal punishment with Gender • COVARIATES (controls) • Age of Student • Length of Relationship • Socioeconomic Status of Family • Social Desirability Scale • OPTIONS • Plot • Effect Size (gives ETA squared) • This violates assumptions of ANCOVA. • So does Frequency score because it is so skewed. Prevalence is the best alternative. F = 4.76, p <.01 Males Females
LOGISTIC REGRESSION IS OFTEN THE BEST APPROACH • * Dependent variable can be dichotomous (binomial) or multinomial • * Dichotomous: CTS Prevalence scores (% perpetrating or % victimized) • * Multinomial examples: Severity Level (None, Minor Only, Severe) • Couple Type (None, Male Only, Female Only, Both) • Allows for: Multiple independent variables and control variables • Gives the“net effect” of each independent variable • * Provides results in two forms that are more widely understood than regression coefficients: • Odds ratio. Example: “The odds ratio of 1.087 indicates that each increase of one point in the seven category corporal punishment index increases the odds of a man physically assaulting his partner by 8.7%” (Straus & Yodanis, 1996) • Predicted Probability of the dependent variable occurring (see example slide) • * USE GRAPHS as in Straus, Murray A. and Carrie L. Yodanis. 1996. "Corporal punishment in adolescence and physical assaults on spouses later in life: What accounts for the link?" Journal of Marriage and the Family 58:825-841.