Download
1 / 20
200 likes | 296 Views
Chapter 2. Density Curves and Normal Distributions. Remember. ALWAYS plot data (usually histogram or stemplot ) Overall Pattern (CUSS) Calculate Numerical Summary NEW – Sometimes overall pattern is so regular it can be described by a smooth curve (called a density curve) fig 2.2 pg78.

E N D
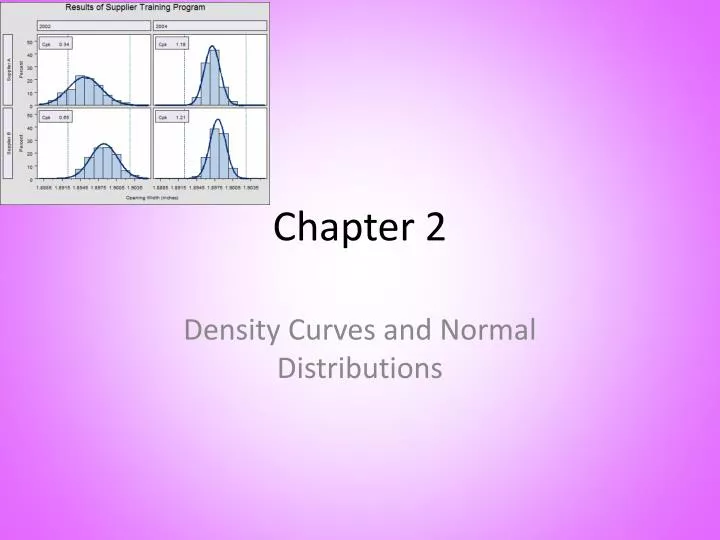
Chapter 2 Density Curves and Normal Distributions
Remember • ALWAYS plot data (usually histogram or stemplot) • Overall Pattern (CUSS) • Calculate Numerical Summary • NEW – Sometimes overall pattern is so regular it can be described by a smooth curve (called a density curve) fig 2.2 pg78
Density Curve • Mathematical Model – an idealized description • Always on or above horizontal axis • Has area of exactly 1 underneath it • Areas under the curve represent proportions of the observations
Mean & Median of Density Curves • Median (pg 81) – the point with half the observations on either side or it is the equal areas point. • Mean (pg 82) – point where the curve would balance if made of solid material • Mean of density curve µ ‘mu’ • Standard deviation σ ‘sigma’
The are under the curve is a rectangle with height 1 and width 1. A uniform Distribution Exercise 2.2 20% , the region is a rectangle with height of 1 and base width of 0.2 • Why is the total area under this curve equal to 1? • What percent of the observations lie above 0.8? • What percent of the observations lie below 0.6? • What percent of the observations lie between 0.25 and 0.75? • What is the mean µ of this distribution? 60% 50% Mean = ½ or 0.5, the ‘balance point’ of the density curve
Quartiles • Divides the area under the curve into quarters • ¼ of the area is left of Q1 • ¾ of the area is left of Q3
Symmetric Curve • Median and mean are equal (2.5a, pg 81) • Skewed Curve • Mean pulled toward the long tail of a skewed distribution
HW Monday • 1, 3, 4 • QUIZ BLOCK DAY first thing then 2.2 • I will be gone on Friday just FYI
Normal Curves • Symmetric, single peaked, and bell shaped; describe normal distributions
Normal Distributions • (all have the SAME overall shape) they are described by giving the mean (µ) and the standard deviation (σ) • Notation is N(µ,σ)
Things to Know • Changing µ without changing σ moves the normal curve along the horizontal axis without changing spread. • Standard deviation controls the spread of a normal curve (fig 2.10) • Inflection points are points located at a distance of σ on either side of µ. • Points where there is a change of curvature. • In general µ and σ do not alone specify shape of most distributions, these are special properties of normal curves.
Importance of Normal Distributions • Good descriptions for some distributions of real data • EX – SAT, IQ Tests, Psychological tests, characteristics of biological populations (lengths of cockroaches, yields of corn) • Good approximations to the results of many kids of chance outcomes • EX – Tossing a coin • Many statistical inference procedures (ch 6-12) based on normal distributions work well with other roughly symmetric distributions.
Lets Draw a normal curve with notationN(64.5, 2.5) Find percentiles for the following heights 64.5 inches 59.5 inches 67 inches 72 inches
HW Tuesday • 6, 7, 8, 14, 13, 15, 11, 12 • PRACTICE DRAWING AND LABELING PICS • QUIZ BLOCK DAY first thing, then 2.2 • I will be gone on Friday just FYI
2.2 Standardizing and z-scores • All normal distributions are the same if we measure in units of size σ about the mean µ as center • Changing to these units is called STANDARDIZING
If x is an observation from a distribution that has mean µ and standard deviation σ, the standardized value of x is • z = x - µ σ Standardized value is often called the z-score
Z-score tells you how many standard deviations the original observation (x) falls away from the mean (µ) and in which direction • Lets look back at N(64.5, 2.5) average adult women
Finding Normal Proportions • State problem, draw pic, shade area of interest • Standardize x, draw new pic • Find area under curve with Table A • Write conclusion in CONTEXT of problem
HW Block Day • 21, 22, 23,24, 28, 29, 30, 31